Displays a table of summary statistics for the yield for each level of each X, Process variable. The summary statistics provided for each level are the number of operations, and the mean, standard error, and standard deviation of the yield. By default, the table is sorted in ascending order by mean yield.
Displays a table of summary statistics for the time intervals of the top 50 levels with the lowest yields. The routine searches for a time interval for each of the top 50 levels in the Levels with Lowest Yield table that minimizes the mean yield within the interval. The interval must contain at least 25% of the operations in that level. The summary statistics provided for each level are the number of operations in the identified interval, the mean yield in the identified interval, the timestamps for the first and last operations in the level (First Time and Last Time), and the timestamps for the first and last operations in the identified interval (RunStart Time and RunEnd Time).
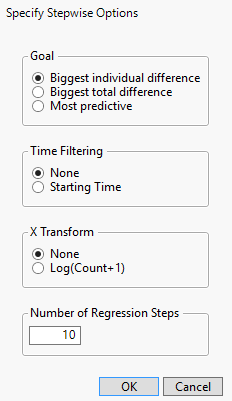
Enables you to use the regular count data or the Log(Count + 1) data for the X, Process variables in the stepwise regression. The Log(Count + 1) option transforms the variables in the regression such that high frequency counts have less of a linear influence in the regression. If you choose the None option, high frequency counts have a linear influence in the regression.
Figure 21.4 Stepwise Regression Window
(Available only if an Order variable is specified in the launch window.) Displays a report of a one-way analysis of the yield on the Order column. The report contains a table for each X, Process column. In each table, the levels of the process column are listed in descending order of LogWorth of the corresponding analysis of variance model. The tables also contain the p-values and a heat map for each level of the process column.