The legend contains descriptions of the shaded regions. If any of the processes are missing a lower or upper specification limit, the legend also shows the markers used for those processes. If the markers do not appear in the legend, then all of the processes in the plot contain both lower and upper specification limits. See One-Sided or Missing Specification Limits.
Figure 10.18 Process Performance Plot
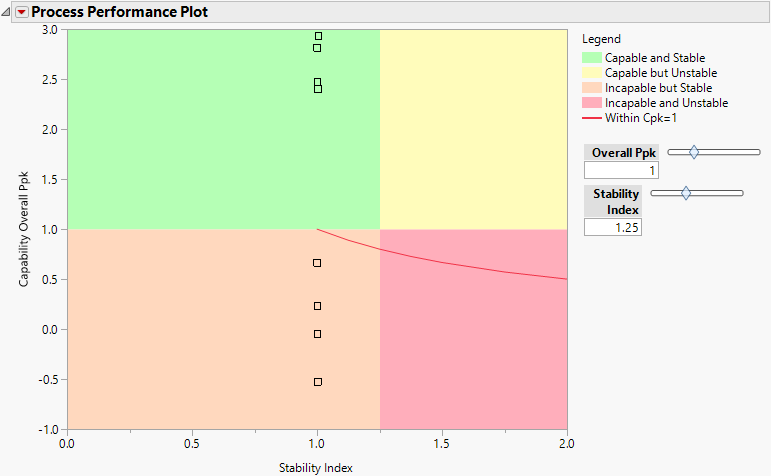
Figure 10.18 shows the Process Performance Plot for a selection of the process variables in the Semiconductor Capability.jmp sample data table using wafer as a subgroup variable.