
Figure 2.49 illustrates part of the profiler for the Reactor.jmp sample data table. The vertical dotted line for each X variable shows its current value or current setting. Use the Profiler to change one variable at a time in order to examine the effect on the predicted response.
Figure 2.49 Illustration of Prediction Traces
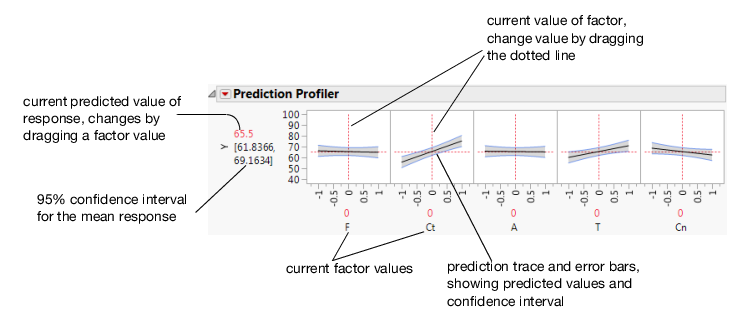
The factors F and Ct in Figure 2.49 are continuous. If the factor is nominal, the levels are displayed on the horizontal axis.
|
•
|
The horizontal dotted line shows the current predicted value of each Y variable for the current values of the X variables.
|