When there are linear dependencies among model effects, the Singularity Details report appears as the first report under the Response report title. It contains a table of the linear functions that the model terms satisfy. These functions define the aliasing relationships among model terms. Figure 2.7 shows an example for the Singularity.jmp sample data table.
Figure 2.7 Singularity Details Report

When there are linear dependencies among effects, estimates of some model terms are not unique. See Models with Linear Dependencies among Model Terms.
When an effect in a model has the response surface (&RS) or mixture response surface (&RS&Mixture) attribute, a Response Surface report is provided. See Figure 2.8 for an example of a Response Surface report for the Tiretread.jmp sample data table.
Figure 2.8 Response Surface Report
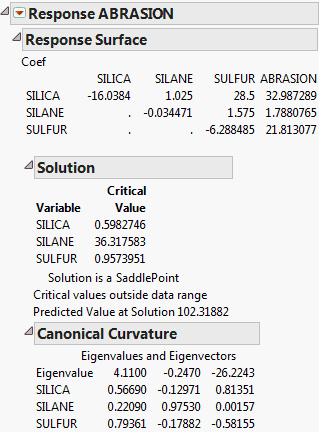
The Coef table shown as the first part of the Response Surface report gives a concise summary of the estimated model parameters. The first columns give the coefficients of the second-order terms. The last column gives the coefficients of the linear terms. To see the prediction expression in its entirety, select Estimates > Show Prediction Expression from the report’s red triangle menu.
|
•
|
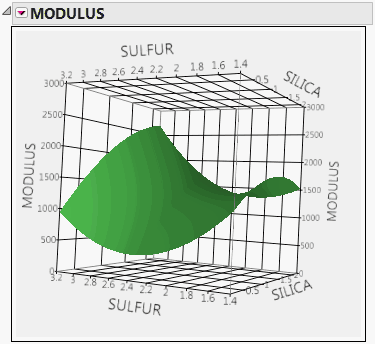
If there are both positive and negative eigenvalues, the surface is saddle shaped, curving up in one direction and down in another direction. See Figure 2.9 for an example using the Tiretread.jmp sample data table.
|
Note: The response surface report is not shown for response surface models consisting of more than 20 factors. No error message or alert is given. For more information about response surface designs, see Response Surface Designs in the Design of Experiments Guide book.
For details about the REML method reports, see Restricted Maximum Likelihood (REML) Method. For details about the EMS method reports, see EMS (Traditional) Model Fit Reports.
 When you enter a Validation column in the Fit Model launch window, a Crossvalidation report is provided. The report gives the following for each of the sets used in validation:
|
–
|
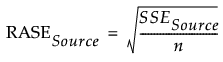
Square and sum the prediction errors to obtain SSESource, where the subscript Source denotes any of the Training, Validation, or Test sets.
|
|
–
|
Square and sum the differences between the actual responses for observations in the Source set and their mean. Denote this value by SSTSource.
|
|
–
|
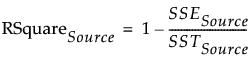
RSquare for the Source set is:
|
|
–
|
Square and sum the prediction errors to obtain SSESource, where the subscript Source denotes any of the Training, Validation, or Test sets.
|
|
–
|