Figure 3.9 Close the Quantiles Report
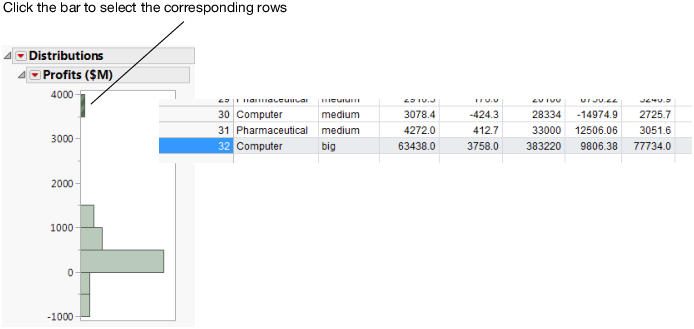
Platform results are connected to the data table. The histogram in Figure 3.10 shows that a group of companies makes a much higher profit that the others. To quickly identify that group, click on the histogram bar for them. The corresponding rows in the data table are selected.