 The Model Comparison Report
Figure 9.7 shows an example of the initial Model Comparison report for a continuous response.
Figure 9.7 Initial Model Comparison Report
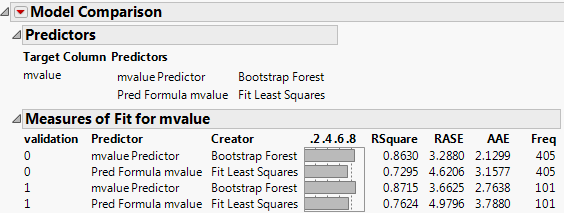
The r-squared statistic. In data tables that contain no missing values, the r-squared statistics in the Model Comparison report and original models match. However, if there are any missing values, the r-squared statistics differ.
|
–
|
A measure that can be applied to general regression models. It is based on the likelihood function L and is scaled to have a maximum value of 1. The value is 1 for a perfect model, and 0 for a model no better than a constant model. The Generalized RSquare measure simplifies to the traditional RSquare for continuous normal responses in the standard least squares setting. Generalized RSquare is also known as the Nagelkerke or Craig and Uhler R2, which is a normalized version of Cox and Snell’s pseudo R2. See Nagelkerke (1991).
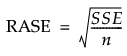
The root mean square error, adjusted for degrees of freedom. For categorical responses, the differences are between 1 and p (the fitted probability for the response level that actually occurred).
The average of the absolute values of the differences between the response and the predicted response. For categorical responses, the differences are between 1 and p (the fitted probability for the response level that actually occurred).
Training and Validation Measures of Fit in Neural Networks provides more information about measures of fit for categorical responses.