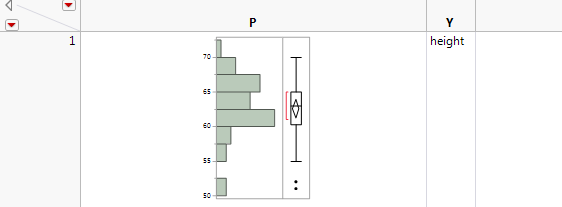
You can add a graph to a new data table. Right-click on a graph and select Edit > Make table of graphs like this. The graph and the variables appear in a new data table.
Figure 9.34 Histogram and Y Variable Added to Data Table