In some plots, you can change marker shapes or colors based on the values of points by adding a row legend. It is called a row legend because JMP automatically inserts a legend using row color or row marker settings. When you assign markers or colors in this way, it assigns the characteristic(s) to all points in a graph, regardless of what points you have selected. All previous marker and color settings are overwritten.
|
2.
|
Select Row Legend.
|
|
3.
|
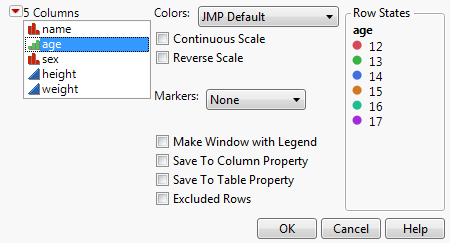
In the window that appears (Figure 9.24), highlight the column whose values you want to color or mark. A preview of the legend is shown on the right.
|
Figure 9.24 Adding a Row Legend
|
•
|