The red triangle menu on the window title bar lists options that affect the report window. If you request XBar and R at the same time, you can check each chart type to show or hide it. The specific options that are available depend on the type of control chart you request. Unavailable options show as grayed menu items.
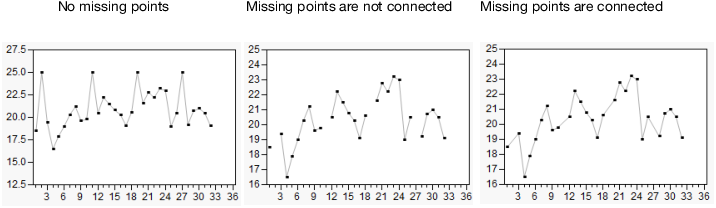
Connects points when some samples have missing values. In Figure 4.10, the left chart has no missing points. The middle chart has samples 2, 11, 19, and 27 missing with the points not connected. The right chart appears if you select the Connect Through Missing option, which is the default.
Figure 4.10 Example of Connected through Missing Option
For Run Charts, when you select the Show Center Line option in the individual Run Chart red triangle menu, a line is drawn through the center value of the column. The center line is determined by the Use Median setting of the main Run Chart red triangle menu. When Use Median is selected, the median is used as the center line. Otherwise, the mean is used. When saving limits to a file, both the overall mean and median are saved.
Figure 4.11 Capability Analysis Window
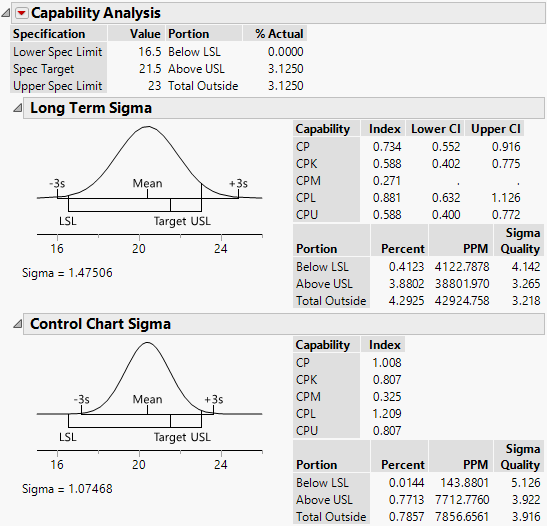
An example of a capability analysis report is shown in Figure 4.12 for Coating.jmp when the Lower Spec Limit is set as 16.5, the Target is set to 21.5, and the Upper Spec Limit is set to 23.
Figure 4.12 Capability Analysis Report for Coating.jmp
For additional information about Capability Analysis, see Capability Analysis in the Basic Analysis book.
Saves the standard deviation and mean for each chart into a new data table. If the limits are constant, the LCL, Avg, and UCL for each chart are saved as well. If there are phases, a new set of values is saved for each phase. You can use this data table to use the limits later. On the Control Chart launch window, click Get Limits and then select the saved data table. See the section Saving and Retrieving Limits for more information.
Enables you to write and run a script that indicates when the data fail special causes tests. Results can be written to the log or spoken. See Tests in Control Chart Builder of this guide for more information. See Run Alarm Scripts in the Scripting Guide for more information about writing custom Alarm Scripts.
See Redo Menus and Save Script Menus in the Using JMP book for more information about the following options: