

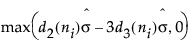
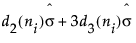
Center line for R-chart: By default, the center line for the ith subgroup (where 3 is the sigma multiplier) indicates an estimate of the expected value of Ri. This value is computed as:  , where
  is an estimate of σ.
, where is an estimate of σ.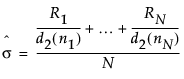
 = weighted average of subgroup means
σ = process standard deviation
d2(n) is the expected value of the range of n independent normally distributed variables with unit standard deviation
d3(n) is the standard deviation of the range of n independent observations from a normal population with unit standard deviation