Bubble Plot supports predefined shapes and custom shapes. Shapes can give visual cues about the data or provide a more interesting shape than a circle. For example, you can show arrows (Figure 12.8) or a hurricane symbol on a map (Figure 12.9).
The Set Shape message specifies the predefined shape:
bp << Set Shape( "Circle"|"Triangle"|"Square"|"Diamond"|"Arrow" );
dt = Open( "$SAMPLE_DATA/PopAgeGroup.jmp" );
bp = dt << Bubble Plot(
X( :Name( "Portion 0-19" ) ),
Y( :Name( "Portion60+" ) ),
Sizes( :Pop ),
ID( :Country )
);
bp << Set Shape( "Diamond" );
Figure 12.8 Diamond Shapes

bp << Set Custom Path( pathMatrix | pathText );
bp << Set Shape( "Custom" );
|
•
|
In Set Custom Path(), the path can consist of an Nx3 matrix or a string that contains SVG code. fill specifies whether a line is drawn (0) or the path is filled (1). The default value is 0.
|
bp << Set Custom Path(
"M-1,-1 L-1,1 L0,0.5 L1,1 L1,-1 L0,-0.5 L-1,-1 Z, ..." );
|
•
|
bp << Set Shape( "Custom" );
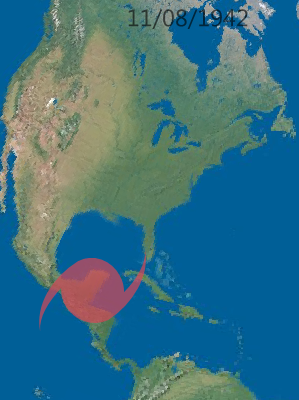
dt = Open( "$SAMPLE_DATA/Hurricanes.jmp" );
dt << Bubble Plot(
X( :Longitude ),
Y( :Latitude ),
Sizes( :Name( "Wind (Knots)" ) ),
Time( :Date ),
Coloring( :Landfall in USA ),
ID( :Name and ID ),
Speed( 220 ),
Bubble Size( 51.43 ),
Time Index( 729.9 ),
Trail Bubbles( 1 ),
All Labels( 0 ),
No Labels( 0 ),
Orient Shapes( 1 ), // rotate shapes in the direction of the movement
// good for animated plots
Set Custom Path( // specify the SVG string
"M-0.99999898,0.00921400000000006 C-0.99999898,-0.51266322 -0.55204076,-0.93622284 -0.000119060000000104,-0.93622284 C0.1835362,-0.93622284 0.3556076,-0.88949112 0.5035232,-0.80766502 C0.3236248,-1.36413554 0.0260398000000001,-1.815694896 -0.3555946,-2 C0.4067376,-1.7567781 0.9372286,-0.91116206 1.0000004,0.00829720000000009 C1.0000004,0.5301742 0.5518026,0.9548002 -0.00011905999999982,0.9547998 C-0.18139054,0.9547998 -0.35150496,0.9090838 -0.49816916,0.8292164 C-0.31759686,1.3771358 -0.0174124399999999,1.8176124 0.3602494,1.999999 C-0.38991788,1.7606584 -0.92375834,0.908779 -0.99999898,0.00921400000000034 z"
),
Set Shape( "Custom" ), // set the custom shape
Title Position( -88.679, 59.73 ),
SendToReport(
Dispatch(
{},
"Bubble Plot",
FrameBox,
{Frame Size( 743, 603 ), Background Map( Images( "Simple Earth" ) ),
Grid Line Order( 3 ), Reference Line Order( 2 )}
)
)
);
Figure 12.9 Custom Hurricane Shape
Search Wikimedia Commons or Google Images and include the keyword SVG. Look for SVG examples that are composed of stroke paths. SVG can be used to represent very complex drawings, with gradients and other elements. Only a path representation, which provides both outline and fill modes, is supported.
You might need to translate and scale the SVG that you find in order to get correct coordinates. Inkscape or similar tools can be useful for doing this manipulation. To copy the path from Inkscape, select Edit > XML Editor, find the svg:path element, and copy the path string from the d Attribute into Set Custom Path().