The Mahalanobis distance takes into account the correlation structure of the data and the individual scales. For each value, the Mahalanobis distance is denoted Mi and is computed as follows:
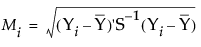
 is the row of means
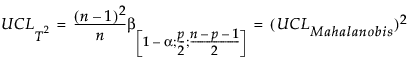
The UCL reference line (Mason and Young 2002) drawn on the Mahalanobis Distances plot is computed as follows:
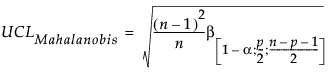
n = number of observations
p = number of variables (columns)
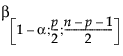
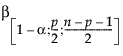 = (1–
= (1– distribution
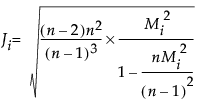
n = number of observations
p = number of variables (columns)
The UCL reference line (Penny 1996) drawn on the Jackknife Distances plot is calculated as follows:
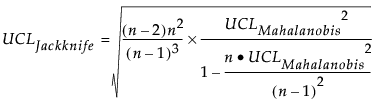
T2 Distance Measures
n = number of observations
p = number of variables (columns)
 = (1–
= (1– distribution