Analyzing a categorical (ordinal or nominal) variable might include questions such as the following:
|
1.
|
|
2.
|
|
3.
|
|
4.
|
Click OK.
|
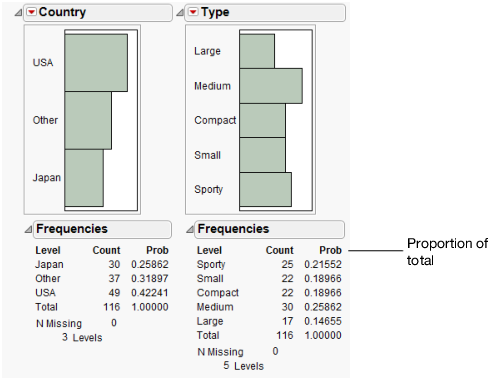
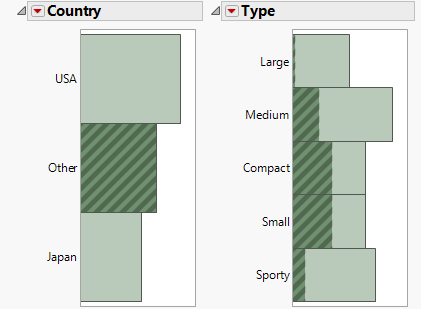
The report window includes a bar chart and a Frequencies report for Country and Type. The bar chart is a graphical representation of the frequency information provided in the Frequencies report. The Frequencies report contains the following:
|
•
|
Figure .10 Japanese Cars
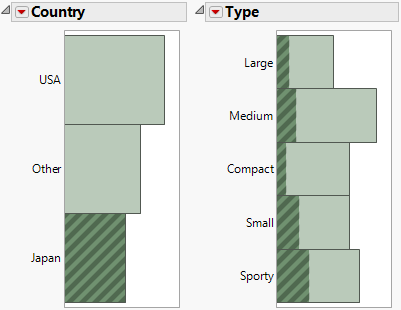
Figure .11 Other Cars