Polygon() works similarly to Line(). They both connect points, but Polygon() returns to the first point to close the polygon and filling the resulting area. You can specify the points as individual points in two-item lists (as shown in Draw Markers) or as matrices of x and then y coordinates. Matrices are flattened by rows, so you can use either row or column vectors, as long as you have the same number of elements in each matrix. First set up the matrices of points and then call them inside Polygon().
gCoordX = [25, 23.75, 22.5, 21.25, 21.25, 22.5, 23.75, 25.625, 27.5, 18.75, 12.5, 6.25, 2.5,
1.25, -1.25, 3.125, 6.25, 12.5, 18.75, 25, 29.375, 34.375, 37.5, 38.75, 40.625, 42.5, 43.125,
42.5, 41.25, 38.75, 43.75, 50, 56.25, 60.625, 63.75, 65.625, 62.5, 56.25, 50, 45, 37.5, 32.5,
28.75, 27.5, 26.25, 25.625, 25];
gCoordY = [-2, 2, 5, 10, 15, 20, 25, 30, 33, 34, 35, 37.5, 40, 41, 43.5, 41, 40, 39, 40, 42, 45,
50, 55, 60, 64, 60, 55, 50, 47, 42, 43.5, 43, 42, 40, 38, 36, 37, 37, 36, 35, 30, 25, 20, 15, 10, 5, 2];
win = New Window( "The JMP Man",
Graph Box(
Frame Size( 300, 300 ),
X Scale( -10, 80 ),
Y Scale( -10, 80 ),
Pen Color( "Black" );
Fill Color( "Blue" );
Polygon( gCoordX, gCoordY );
Fill Color( "Black" );
Circle( {18, 58}, 9, "FILL" );
)
);
Figure 12.17 Drawing a Polygon
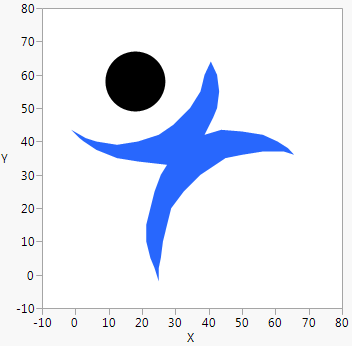
A related command, In Polygon(), tells whether a given point falls inside the specified polygon. This code checks some points from the JMP man pictured in Figure 12.17:
In Polygon( 0,60, GcoordX,GCoordY ); // return 0
In Polygon( 30,38, GcoordX,GCoordY ); // return 1
You can add In Polygon() to the JMP man script. Run the following script, and then click various locations in the picture and watch the log window. “In” and “out” are printed to the log when you click the body.
gCoordX = [25, 23.75, 22.5, 21.25, 21.25, 22.5, 23.75, 25.625, 27.5, 18.75, 12.5, 6.25, 2.5, 1.25, -1.25, 3.125, 6.25, 12.5, 18.75, 25, 29.375, 34.375, 37.5, 38.75, 40.625, 42.5, 43.125, 42.5, 41.25, 38.75, 43.75, 50, 56.25, 60.625, 63.75, 65.625, 62.5, 56.25, 50, 45, 37.5, 32.5, 28.75, 27.5, 26.25, 25.625, 25];
gCoordY = [-2, 2, 5, 10, 15, 20, 25, 30, 33, 34, 35, 37.5, 40, 41, 43.5, 41, 40, 39, 40, 42, 45, 50, 55, 60, 64, 60, 55, 50, 47, 42, 43.5, 43, 42, 40, 38, 36, 37, 37, 36, 35, 30, 25, 20, 15, 10, 5, 2];
win = New Window( "The JMP Man",
Graph Box(
Frame Size( 300, 300 ),
X Scale( -10, 80 ),
Y Scale( -10, 80 ),
Pen Color( "Black" );
Fill Color( "Black" );
Polygon( gCoordX, gCoordY );
Mousetrap(
{},
Print( If( In Polygon( x, y, gCoordX, gCoordY ), "in", "out" ) )
);
)
);
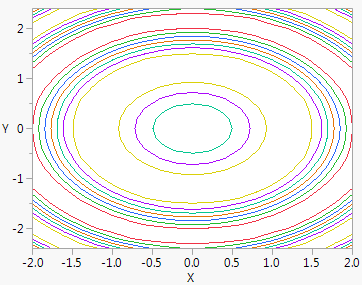
Contour() draws contour lines using a grid of coordinates.
Contour( xVector, yVector, zGridMatrix, zContour, <zColors> );
Suppose that you have an n by m matrix zGridMatrix of values on some surface (defined across the n values of xVector by the m values of yVector). Contour() draws the contour lines that are defined by the values in zContour in the colors defined by zColors. Here is an example:
x = (-10 :: 10) / 5;
y = (-12 :: 12) / 5;
grid = J( 21, 25, 0 );
z = [-.75, -.5, -.25, 0, .25, .5, .75];
zcolor = [3, 4, 5, 6, 7, 8, 9];
For( i = 1, i <= 21, i++,
For( j = 1, j <= 25, j++,
grid[i, j] = Sin( (x[i]) ^ 2 + (y[j]) ^ 2 )
)
);
Show( grid );
win = New Window( "Hat",
Graph Box(
X Scale( -2, 2 ),
Y Scale( -2.4, 2.4 ),
Contour( x, y, grid, z, zcolor )
)
);
Figure 12.18 Drawing Contour Lines