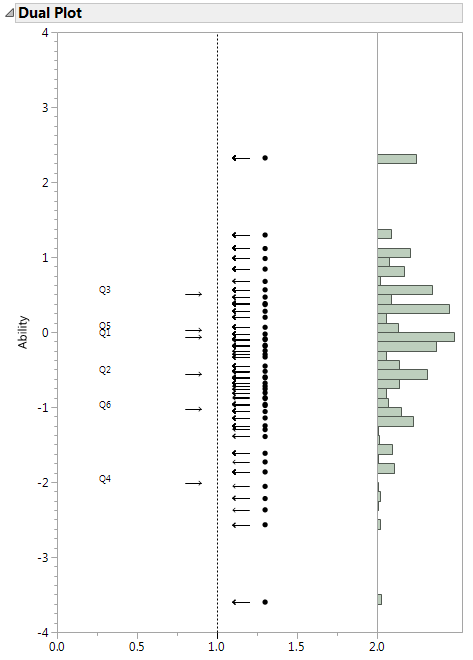
The Dual Plot report contains a plot that shows item difficulty and subject ability in one plot. Difficulty and ability use a common standardized scale shown on the y-axis. The items are plotted by their difficulty on the left side of the plot. The subjects are plotted to the right with data points and a histogram. The dual plot enables you to relate the difficulty of each item to the ability of each respondent.
Figure 10.7 Dual Plot