|
1.
|
|
2.
|
Select Analyze > Specialized Modeling > Gaussian Process.
|
|
3.
|
|
4.
|
 In JMP Pro, to run the analysis faster, leave the Fast GASP checked.
|
6.
|
Click OK.
|
Figure 15.5 Borehole Latin Hypercube Report
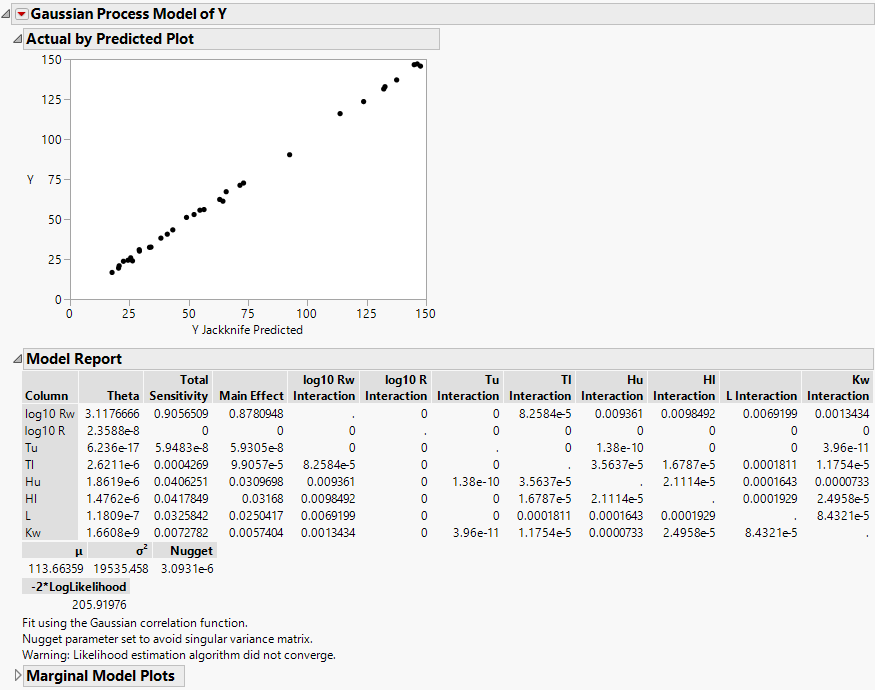
Figure 15.6 Gaussian Process Model Profiler
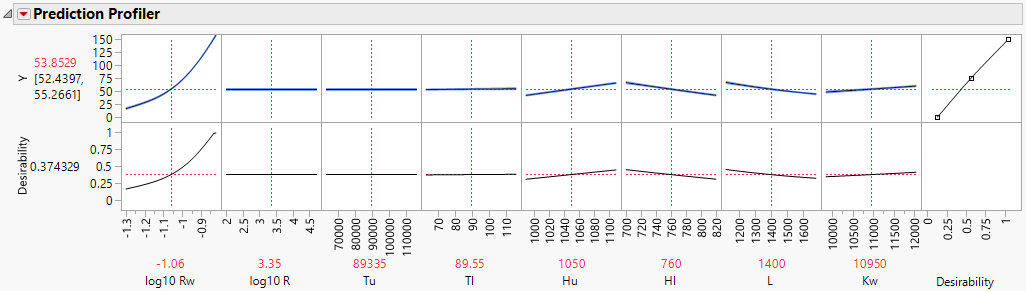
The desirability function is set to maximize the response Y because Y has goal set to Maximize in the Response Limits column property.
Note: Your estimates can differ from those shown in Figure 15.5, which were found using the Fast GASP algorithm.