For the latest version of JMP Help, visit JMP.com/help.

1.
Select Help > Sample Data Library and open Variability Data/2 Factors Crossed.jmp.
2.
Select Analyze > Quality and Process > Variability / Attribute Gauge Chart.
3.
For Chart Type, select Variability.
4.
Select Measurement and click Y, Response.
5.
Select Operator and click X, Grouping.
6.
Select part# and click Part, Sample ID.
7.
8.
From the red triangle menu for Variability Gauge, select Show Group Means and Connect Cell Means.
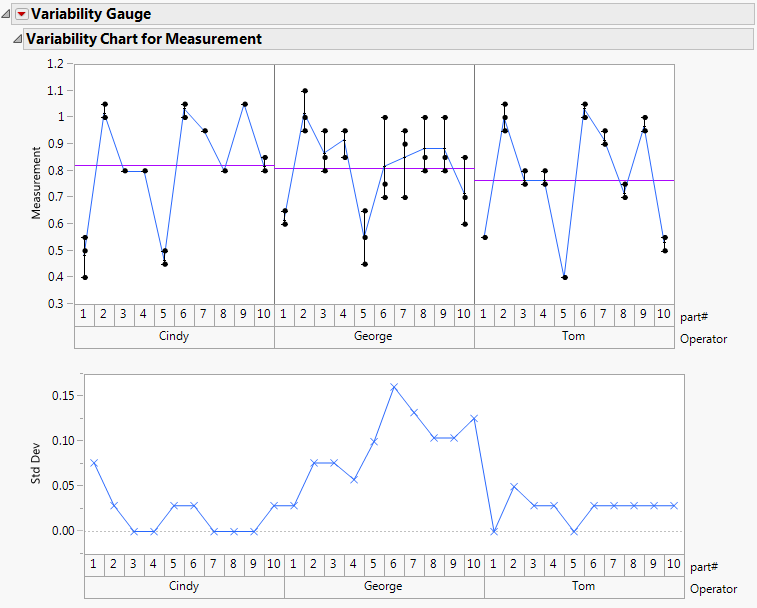
Figure 9.2 Example of a Variability Chart

Help created on 3/19/2020