This example uses the Office Visits.jmp sample data table, which records late and on-time appointments for six clinics in a geographic region. 60 random appointments were selected from 1 week of records for each of the six clinics. To be considered on-time, the patient must be taken to an exam room within five minutes of their scheduled appointment time. Examine the proportion of patients that arrived on-time to their appointment.
|
1.
|
|
2.
|
Select Analyze > Fit Y by X.
|
|
3.
|
|
4.
|
|
5.
|
|
6.
|
Click OK.
|
|
7.
|
From the red triangle menu next to Contingency Analysis, select Analysis of Means for Proportions.
|
|
8.
|
From the red triangle menu next to Analysis of Means for Proportions, select Show Summary Report and Switch Response Level for Proportion.
|
Figure 7.9 Example of Analysis of Means for Proportions
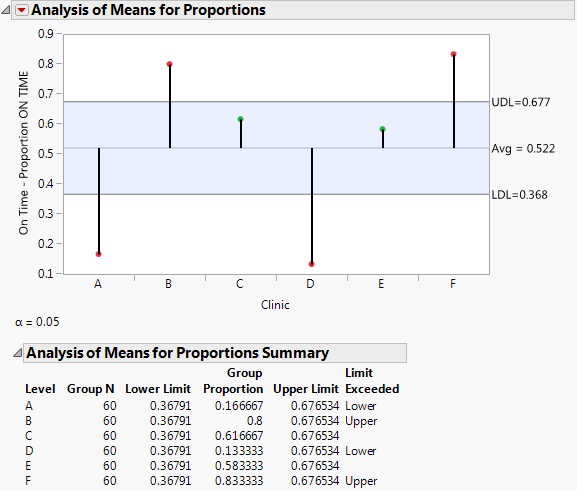
Figure 7.9 shows the proportion of patients who were on-time from each clinic. From Figure 7.9, notice the following: