 Example of Boosted Tree with a Categorical Response
|
1.
|
|
2.
|
Select Analyze > Predictive Modeling > Boosted Tree.
|
|
3.
|
|
4.
|
|
5.
|
Enter 0.2 for Validation Portion.
|
|
6.
|
Click OK.
|
|
7.
|
(Optional) In the Reproducibility panel, select Suppress Multithreading and enter 123 for Random Seed.
|
|
8.
|
Click OK.
|
Figure 7.2 Overall Statistics for Nominal Response
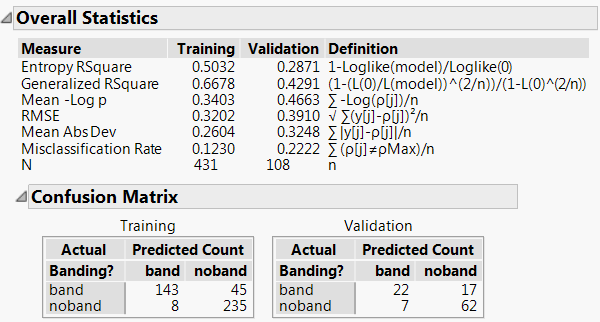
Because the response, Banding?, is categorical, the Boosted Tree analysis provides a Misclassification Rate under Measure and a Confusion Matrix report. The Misclassification Rate for the validation set is 0.2222, or about 22%.
|
9.
|
Click the red triangle next to Boosted Tree for Banding? and select Show Trees > Show names categories estimates.
|
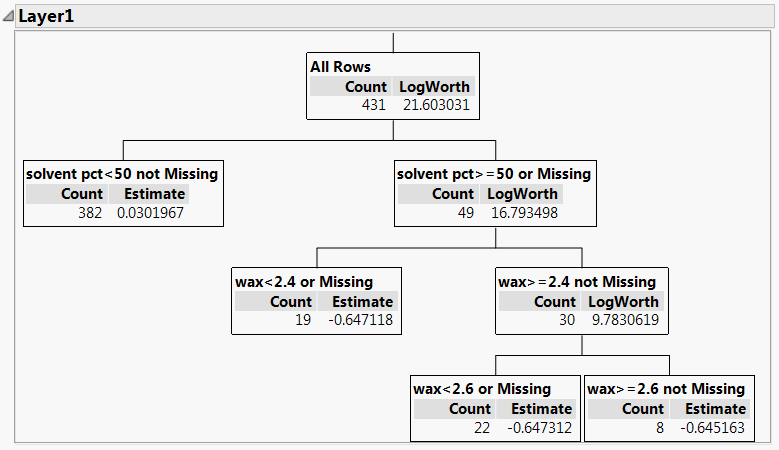
Figure 7.3 Layer 1 of the Boosted Tree
|
10.
|
Click the red triangle next to Boosted Tree for Banding? and select Save Columns > Save Prediction Formula.
|
Columns called Prob(Banding?==noband), Prob(Banding?==band), and Most Likely Banding? are added to the data table. Examine the Prob(Banding?==noband) column to see how model predictions are calculated from the layers.