dt = Open( "$SAMPLE_DATA/Big Class.jmp" );
biv = dt << Bivariate( Y( weight ), X( height ) ); // a reference to the platform
biv << Fit Spline( 1000000 ) << Fit Mean;
biv << Fit Polynomial( 4, {Line Color( RGBColor( 1, 0.5, 0 ) )}); // degree 4, orange curve
biv << ( Curve[1] << Line Color( red ) ); // first curve is red
|
4.
|
Assign rbiv to the report layer:
|
rbiv = biv << Report;
rbiv[Frame Box( 1 )] << Size Window( 500, 700 );
biv << Scroll Window( {0, 0} );
rbiv = biv << Report; // a reference to the report
Show Properties( rbiv ); // show the properties of the report
|
Note: The log lists the messages to use with reports. Using Show Properties() is an alternative to the Scripting Index.
Close [Boolean] GetOpen [Action] [Scripting Only] SetOpen [Boolean] [Scripting Only] ... |
rbiv["Fit Mean"] << Close( 0 );
Close() is a Boolean function (true or false), and passing 0 indicates that the outline is not closed.
rbiv["Summary of Fit"] << Select;
rbiv["Parameter Estimates"] << Select;
rbiv["Analysis of Variance"] << Select;
rbiv["Polynomial Fit Degree=4", "Parameter ?", Column Box( "Estimate" )] << Select; // dig down in the outline tree
rbiv << Deselect;
pe = rbiv["Polynomial Fit Degree=4", "Parameter ?"];
ests = pe[Number Col Box( "Estimate" )];
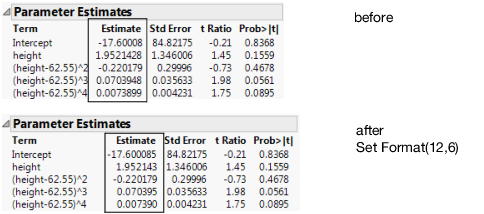
ests << Set Format( 12, 6 );
The first argument to Set Format sets the column width by the number of characters to display. The second argument sets how many decimal places are shown in the table.
Figure 11.8 Applying Changes to a Report
|
Note: You can even get a single number out of the table. For example, the estimate for the cubic term:
terms = pe[String Col Box( "Term" )]; // find the Term column estimate = .; // in case there is no cubic term Try(
For( i = 1, i < 10, i++, If( Contains( terms << Get( i ), "^3" ), // get(i) goes off the end of the table handled by Try
estimate = ests << Get( i ); Break(); ) ) ); Show( estimate );
0.070394822744608 |
|
10.
|
Use a For() loop to count down to the row for the term that you want. The second argument to For() is a condition; as long as the condition tests true, looping continues. Here the test is “when the string in the Terms column is not "^3" and we have not reached the tenth row.” As soon as the string does match, looping stops and i’s value is the number for the matching row. You then use i as a subscript to the Get message on the Estimates column.
|
myVector = rbiv[Table Box( 5 )][Number Col Box( "Sum of Squares" )] << Get as Matrix;
// get the values in the Sum of Squares column as a matrix
dt << New Column( "Sum of Squares", Values( myVector ) );
// create a new column in Big Class.jmp named "Sum of Squares"
// insert the values of myVector in the column
rbiv[Table Box( 5 )] << Make Data Table( "ANOVA table" );
// put the values of the fifth table box into a new data table
rbiv[Axis Box( 1 )] << Min( 70 ) << Max( 170 ); // set the Y axis
rbiv[Axis Box( 2 )] << Min( 50 ) << Max( 70 ); // set X axis
rbiv[Picture Box( 1 )] << Copy Picture;