 Example of K Nearest Neighbors with Continuous Response
In this example, you want to predict the percent body fat for males using 13 predictors. The Body Fat.jmp sample data table contains percent body fat estimates that are based on underwater weighing and on various body circumference measurements.
|
1.
|
|
2.
|
Select Analyze > Predictive Modeling > K Nearest Neighbors.
|
|
3.
|
|
4.
|
|
5.
|
|
6.
|
Click OK.
|
|
7.
|
Figure 8.3 K Nearest Neighbors Report
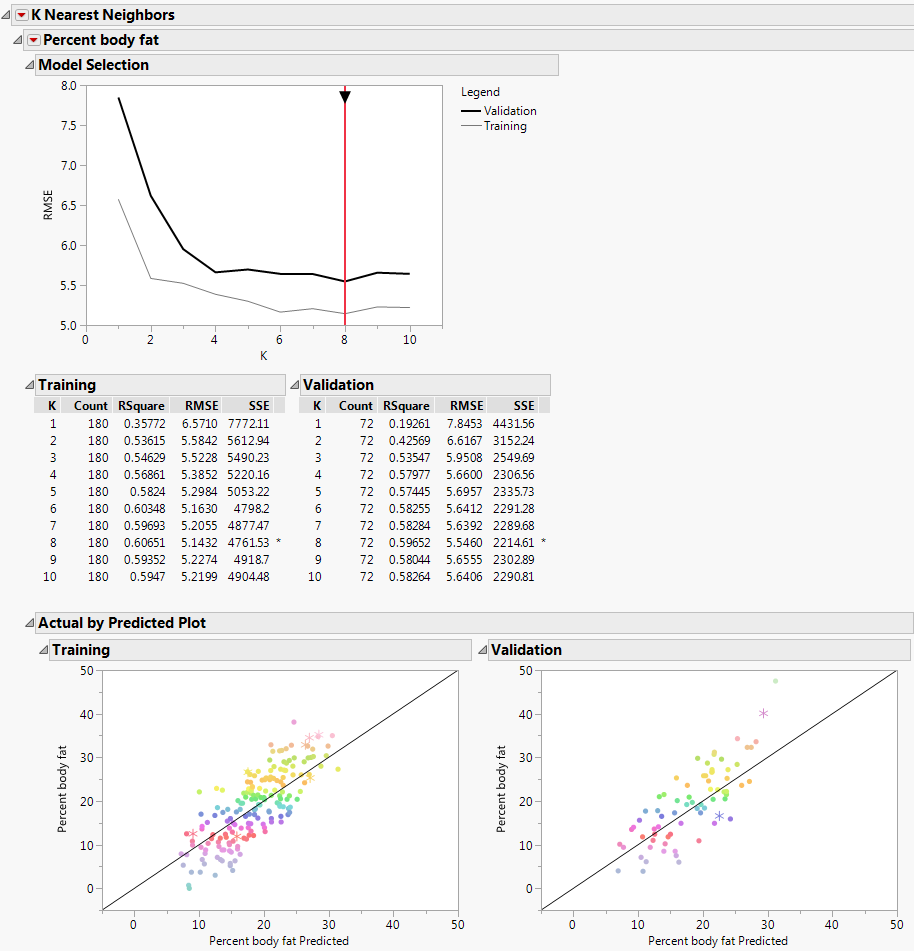
The K = 8 model had the lowest RMSE for the validation set. Among k nearest neighbor models, the model based on 8 nearest neighbors seems to perform the best. The Actual by Predicted plot for the training set shows that the points fall along the line, signifying that the predicted values are similar to the actual values. Most of the points on the plot for the validation set fall along the line, with a few observations on the upper end that are a bit farther away.