|
1.
|
|
2.
|
Select Analyze > Fit Y by X.
|
|
3.
|
|
4.
|
Notice that JMP automatically fills in Count for Freq. Count was previously assigned the role of Freq.
|
5.
|
Click OK.
|
|
6.
|
From the red triangle menu, select ROC Curve.
|
|
7.
|
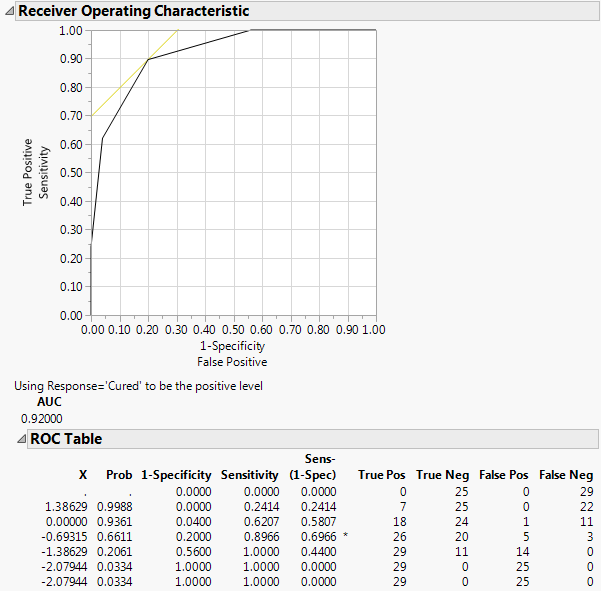
Note: This example shows a ROC Curve for a nominal response. For details about ordinal ROC curves, see ROC Curve in the Predictive and Specialized Modeling book.
The results for the response by ln(dose) example are shown here. The ROC curve plots the probabilities described above, for predicting response. Note that in the ROC Table, the row with the highest Sens-(1-Spec) is marked with an asterisk.
Figure 8.9 Examples of ROC Curve and Table