|
1.
|
|
2.
|
Select Graph > Legacy > Treemap.
|
|
3.
|
|
4.
|
|
5.
|
Click OK.
|
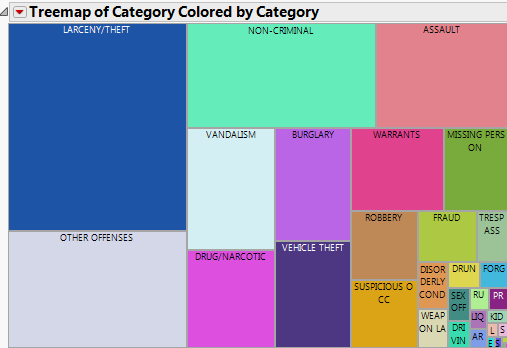
Figure 11.14 Crime Frequencies
|
6.
|
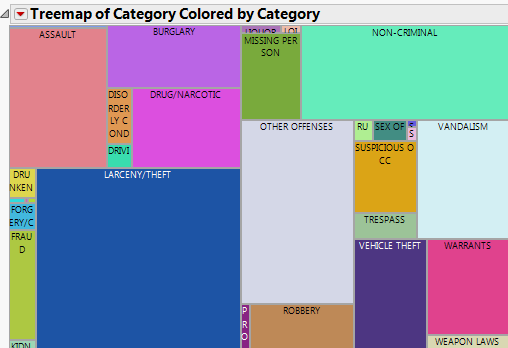
From the red triangle menu, select Layout > Squarify.
|
Figure 11.15 Squarify Crime Data