|
1.
|
|
2.
|
Select Graph > Custom Profiler.
|
|
3.
|
|
4.
|
Click OK.
|
Figure 7.3 Custom Profiler Report
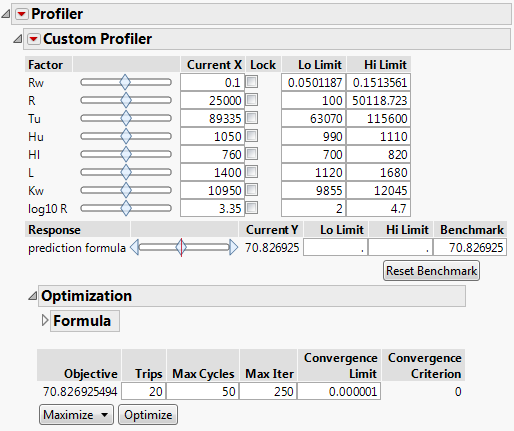
Note: To view the description of a factor, right-click the corresponding column in the data table and select Column Info.
|
5.
|
|
6.
|
In the Custom Profiler Report, click Optimize.
|
Figure 7.4 Optimized Custom Profiler Report
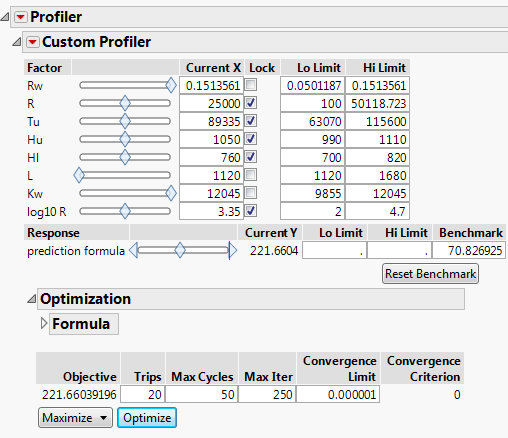
The optimization routine found an optimum predicted response at 221.66. In order to obtain the optimum of 221.66, Rw and Kw are set to their maximum values and L is set to its minimum value. The optimum is greater than the initial Benchmark value of 70.83.