|
1.
|
|
2.
|
Select Analyze > Fit Y by X.
|
|
3.
|
|
4.
|
|
5.
|
Click OK.
|
Figure 5.18 Example of SAT Scores by Percent Taking
|
6.
|
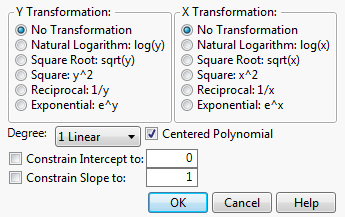
From the red triangle menu for Bivariate Fit, select Fit Special. The Specify Transformation or Constraint window appears. For a description of this window, see Fit Special.
|
Figure 5.19 The Specify Transformation or Constraint Window
|
7.
|
Within Y Transformation, select Natural Logarithm: log(y).
|
|
8.
|
Within X Transformation, select Square Root: sqrt(x).
|
|
9.
|
Click OK.
|
Figure 5.20 Example of Fit Special Report
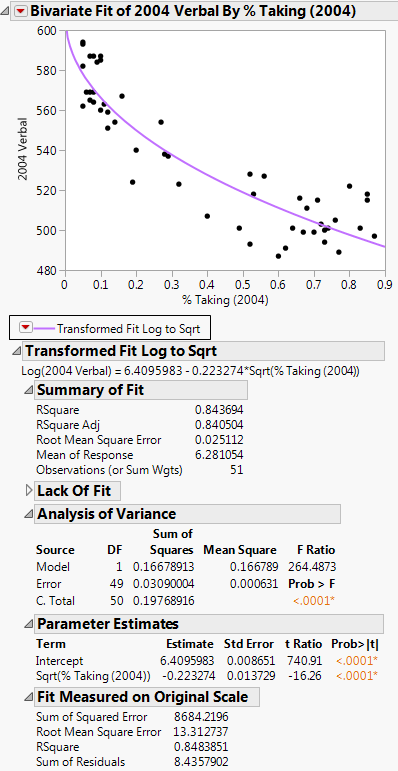
Figure 5.20 shows the fitted line plotted on the original scale. The model appears to fit the data well, as the plotted line goes through the cloud of points.