In JMP, you create dashboards in Dashboard Builder. See Combine Reports by Creating a Dashboard in Using JMP for details. This section shows how to write scripts to create dashboards.
dt = Open( "$SAMPLE_DATA/Big Class.jmp" );
New Window( "My Dashboard",
H Splitter Box( // place reports in a splitter box
Size( 700, 400 ),
Tab Page Box( // place report in a tab page box
Title( "Bivariate Fit of weight by height" ),
dt << Bivariate( // Bivariate report
Y( :weight ),
X( :height ),
Fit Line,
Report View( "Summary" ) // show only the graph
),
<<Moveable( 1 ) // make the report moveable
),
Tab Page Box(
Title( "Oneway Analysis of height by sex" ),
dt << Oneway( // Oneway report
Y( :height ),
X( :sex ),
Means( 1 ),
Mean Diamonds( 1 ),
Report View( "Summary" )
),
<<Moveable( 1 )
),
/* each tab box can be dragged to a different location
required for moveable display boxes */
<<Dockable( 1 )
)
);
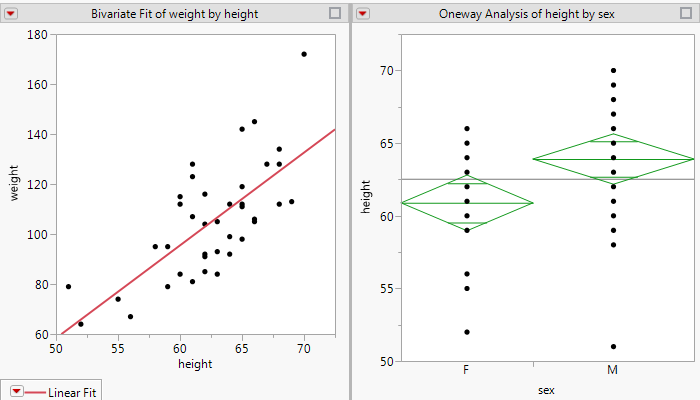
Figure 11.27 Dashboard with Two Reports
dt = Open( "$SAMPLE_DATA/Big Class.jmp" );
New Window( "My Dashboard",
Tab Box( // place reports in a tab box
Tab Page Box( // place report in a tab page box
Title( "Bivariate Fit of weight by height" ),
dt << Bivariate( // Bivariate report
Y( :weight ),
X( :height ),
Fit Line,
Report View( "Summary" ) // show only the graph
),
<<Moveable( 1 ), // make the report moveable
<<Closeable( 1 ) // make the report closeable
),
Tab Page Box(
Title( "Oneway Analysis of height by sex" ),
dt << Oneway( // Oneway report
Y( :height ),
X( :sex ),
Means( 1 ),
Mean Diamonds( 1 ),
Report View( "Summary" )
),
<<Moveable( 1 ),
<<Closeable( 1 )
),
<<Dockable( 1 ),
/* each tab box can be dragged to a different location
required for moveable display boxes */
<<Set Overflow Enabled( 0 ) // both tab pages appear
)
);
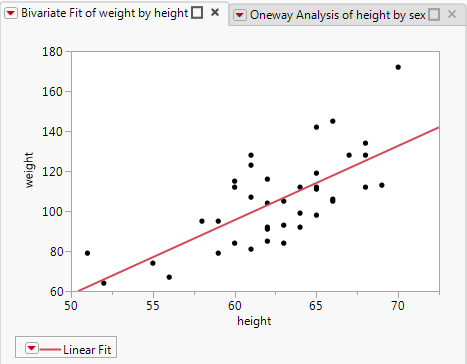
Figure 11.28 Dashboard with Tabs
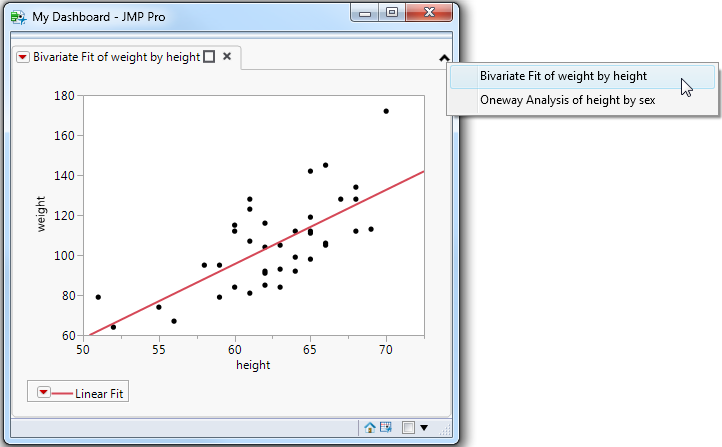
In a dashboard with several tabs, the window widens to show all tabbed reports. You might want to show only the first report and then let the user select the other tabbed reports from a list. Change Set Overflow Enabled( 0 ) near the end of the script to Set Overflow Enabled( 1 ). Figure 11.29 shows the result.
Figure 11.29 Dashboard with Overflow Tabs
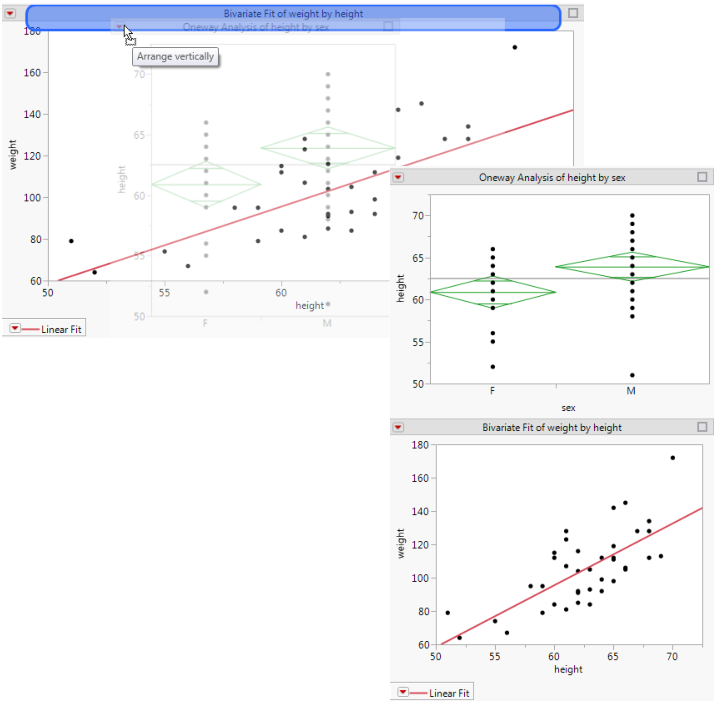
A docking layout is a collection of Tab Page Box() objects and docking containers that enable reports to be rearranged. In the report window, you drag a docked tab to a highlighted drop zone to create a new layout. Figure 11.27 shows two docked reports. In Figure 11.30, the Oneway report was dragged to the highlighted drop zone to display the reports in one column.
Figure 11.30 Docking a Tab in a Dashboard
You combine Tab Box() with Splitter Box() to create docked tabs. Tab boxes and splitter boxes must directly contain other docking containers or the tab pages that define the content. Note the stacked boxes from a portion of the preceding example:
H Splitter Box( // place reports in a splitter box
Size( 700, 400 ),
Tab Page Box( // place report in a tab page box
Tab Box << Set Dockable();
Splitter Box << Set Dockable();
Tab Page Box << Set Closeable();
Use the Tab Page Box <<Set Close message to run a JSL script when the close button  is clicked. A return value of “1” indicates that the tab is closed. A return value of “0” indicates that closing the tab is not allowed at that time. Closing the tab might not be allowed as the result of a user prompt or based on the state of the program.
is clicked. A return value of “1” indicates that the tab is closed. A return value of “0” indicates that closing the tab is not allowed at that time. Closing the tab might not be allowed as the result of a user prompt or based on the state of the program.When a docking layout includes tab page boxes, you may place many pages in a single Tab Box() container. In this case, the titles may become wider than the actual content or wider than desired in the overall display. The Tab Box <<Set Overflow Enabled( 0|1 ) message specifies that the tab titles should not cause the tab box to grow wider. If the titles do not all fit, a pop-up button appears in the upper right corner of the tab box to select tabs that are in the “overflow list”. See Figure 11.29 for an example.