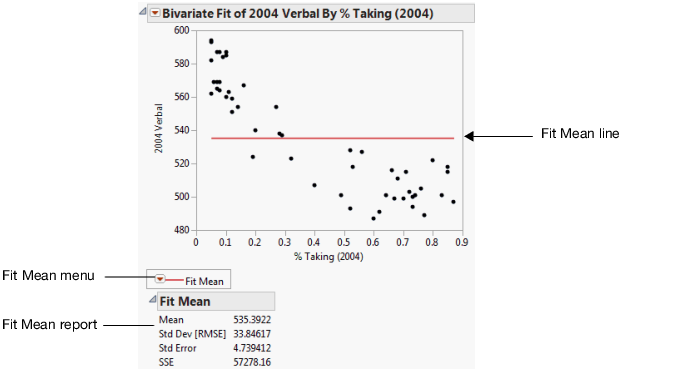
Using the Fit Mean option, you can add a horizontal line to the scatterplot that represents the mean of the Y response variable. You can start by fitting the mean and then use the mean line as a reference for other fits (such as straight lines, confidence curves, polynomial curves, and so on).
Figure 5.7 Example of Fit Mean