The Gauge R&R option shows measures of variation interpreted for a gauge study of operators and parts.
Once you select the Gauge R&R option, if you have not already selected the model type, you are prompted to do so. Then, modify the Gauge R&R specifications.
Select Tolerance Interval to enter the tolerance directly, where tolerance = USL – LSL.
Select LSL and/or USL to enter the specification limits and then have JMP calculate the tolerance.
K is a constant value that you choose to multiply with sigma. For example, you might type 6 so that you are looking at 6*sigma or a 6 sigma process.
Enter upper and lower specification limits. For more information, see Spec Limits in the Using JMP book.
Figure 9.7 Example of the Gauge R&R Report
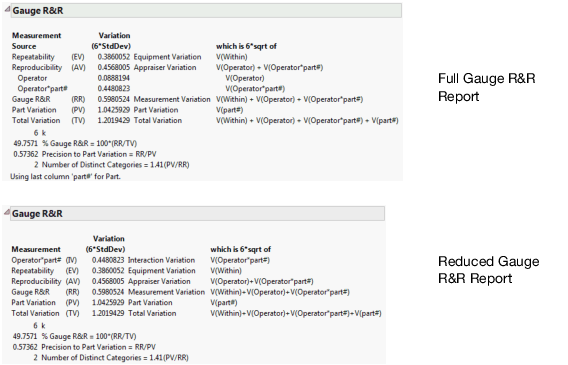
Note: To generate the reduced Gauge R&R report, select File > Preferences > Platforms > Variability Chart > Reduced Gauge R&R Report.
In this example, the values in the Variation column are the square roots of sums of variance components scaled by the value of k (6 in this example).
|
•
|
If you have provided a Tolerance Interval in the Enter/Verify Gauge R&R Specifications window, a % of Tolerance column appears in the Gauge R&R report. This column is computed as 100*(Variation/Tolerance). Also, a Precision-to-Tolerance ratio appears at the bottom of the report. This ratio represents the proportion of the tolerance or capability interval that is lost due to gauge variability.
|
|
•
|
If you have provided a Historical Sigma in the Enter/Verify Gauge R&R Specifications window, a % Process column appears in the Gauge R&R report. This column is defined as follows: 100*(Variation/(K*Historical Sigma)).
|