
Figure .2 Example of a Histogram
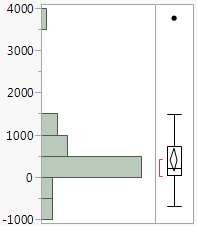
This example uses the Companies.jmp data table, which contains data on profits for a group of companies.
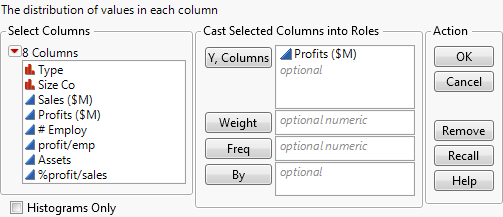
To answer these questions, use a histogram of Profits ($M).
|
1.
|
|
2.
|
|
3.
|
|
4.
|
Click OK.
|
|
•
|
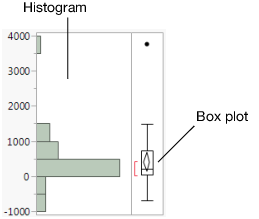
One company has significantly higher profits than the others, and might be an outlier. An outlier is a data point that is separated from the general pattern of the other data points.
|
|
•
|
The box plot, which is another graphical summary of the data. For detailed information about the box plot, see Box Plot in the Essential Graphing book.
|
|
•
|
Quantiles and Summary Statistics reports. These reports are discussed in Analyze Distributions in Analyze Your Data.
|