Use the Knotted Spline Effect option to fit a segmentation of smooth polynomials to a specified effect. When you select this attribute, a window appears, enabling you to specify the number of knot points. (Knotted splines are implemented only for main-effect continuous terms.)
JMP follows the advice in the literature in positioning the points. The knotted spline is also referred to as a Stone spline or a Stone-Koo spline. See Stone and Koo (1985). If there are 100 or fewer points, the first and last knots are the fifth point inside the minimum and maximum, respectively. Otherwise, the first and last knots are placed at the 0.05 and 0.95 quantiles if there are 5 or fewer knots, or the 0.025 and 0.975 quantiles for more than 5 knots. The default number of knots is 5 unless there are 30 or fewer points. In that case, the default is 3 knots.
|
•
|
|
1.
|
|
2.
|
Select Analyze > Fit Model.
|
|
3.
|
|
4.
|
|
5.
|
Figure 4.21 Fit Model Launch Window
|
7.
|
Click Run.
|
|
8.
|
From the report’s red triangle menu, select Estimates > Custom Test.
|
|
9.
|
Click the Add Column button twice to produce a total of three columns.
|
|
10.
|
In the first column, type 1 for age&Knotted@4.5.
|
|
11.
|
In the second column, type 1 for age&Knotted@20.5.
|
|
12.
|
In the third column, type 1 for age&Knotted@36.
|
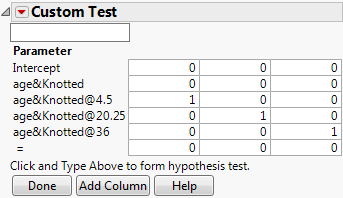
Figure 4.22 Values for the Custom Test for Curvature
|
13.
|
Click Done.
|
The report in Figure 4.23 appears. The small Prob > F value indicates that there is curvature.
Figure 4.23 Curvature Report