The Lift Curve option provides another plot to display the predictive ability of a partition model. The lift curve plots the lift versus the portion of the observations. There is a point for each unique predicted probability value. Each predicted probability of a response level defines a portion of the observations that have a predicted probability greater than or equal to the unique predicted probability value. For a particular level of the response, the lift value is the ratio of the proportion of observed responses in that portion to the overall proportion of observed responses.
Note: For smaller models, it is possible that a large portion of the points have the same predicted probability value. If this probability is the highest predicted probability for the response level, the lift curve does not start at Portion = 0. For example, this is shown in the Low lift curve in Figure 5.18.
Figure 5.18 Lift Curve
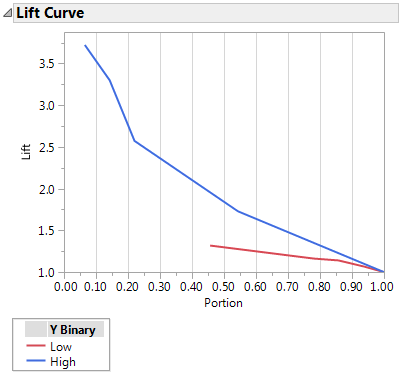
Figure 5.19 Lift Table for Lift Curve
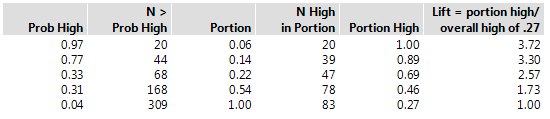
Figure 5.19 provides a table of values to demonstrate the calculation of Lift and Portion used for the High lift curve shown in Figure 5.18. A partition model with five splits was built to predict the response, Y Binary. Y Binary has two levels: Low and High. The lift curve is based on 309 observations. There are 83 observed High responses for an overall rate of 0.27.
|
•
|
Prob High: The five unique predicted probability values from the partition model for the High response level.
|
|
•
|
N > Prob High: The number of observations that have a predicted probability value equal to or greater than the value in Prob High.
|
|
•
|
Portion: N > Prob High divided by 309, the total number of observations.
|
|
•
|
N High in Portion: The number of observations in each portion that have an observed High response.
|
|
•
|
|
•
|
Lift: Portion High divided by 0.27, the overall rate of the observed High response.
|