The Control Panel for the Cytometry.jmp data table, with the variables CD3 through MCB as Y, Columns, is shown in Figure 13.5. You can fit various numbers of clusters using the Control Panel iteratively or you can specify a range using the Range of Clusters option.
Figure 13.5 Control Panel for Normal Mixtures Method
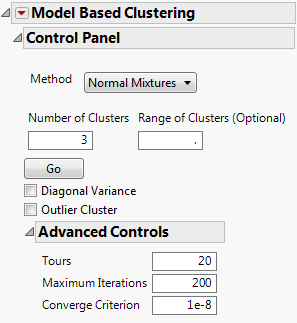
Provides an upper bound for the number of clusters to form. If a number is entered here, the platform creates separate analyses for every integer between Number of clusters and the value entered as Range of Clusters (Optional).