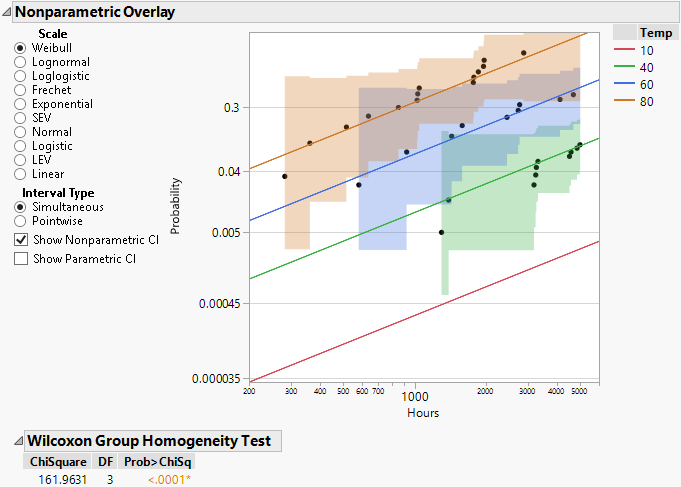
The Nonparametric Overlay plot is displayed after the scatterplot. Differences among groups can readily be detected by examining this plot. For the Devalt.jmp sample data, you can view these differences for Hours on different scales. You can also change the interval type on a Nonparametric fit probability plot between Simultaneous and Pointwise (results displayed when Show Nonparametric CI is selected), and select whether to Show Parametric CI or Show Nonparametric CI confidence intervals.
Pointwise estimates show the pointwise 95% confidence bands on the plot while simultaneous confidence intervals show the simultaneous confidence bands for all groups on the plot. Meeker and Escobar (1998, ch. 3) discuss pointwise and simultaneous confidence intervals and the motivation for simultaneous confidence intervals in a lifetime analysis.
For this example, the Wilcoxon Group Homogeneity Test, shown in Figure 4.8, indicates that there is a difference among groups. The high chi-square value and low p-value are consistent with the differences seen among the Temp groups in the Nonparametric Overlay plot.