The Bottle Tops.jmp sample data contains simulated data from a bottle top manufacturing process. Sample is the sample ID number for each bottle. Status indicates whether the bottle top conformed to the design standards. In the Phase column, the first phase represents the time before the process adjustment. The second phase represents the time after the process adjustment. Notes on changes in the process are also included.
|
1.
|
|
2.
|
Select Analyze > Quality and Process > Control Chart Builder.
|
|
3.
|
|
4.
|
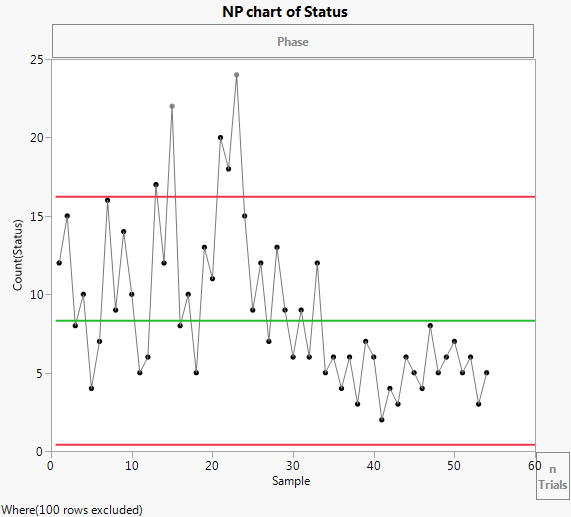
Figure 3.18 np-chart of Status (Nonconforming)
|
5.
|
Figure 3.19 np-chart by Phase
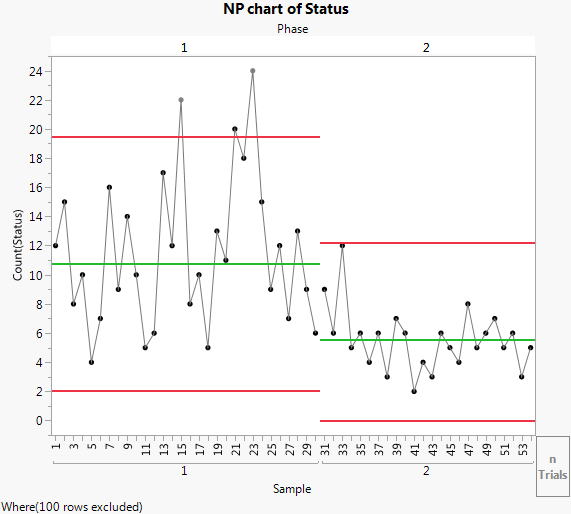
Including the Phase variable means that the control limits for phase 2 are based only on the data for phase 2. None of the phase 2 observations are outside the control limits. Therefore, you can conclude that the process is in control after the adjustment.