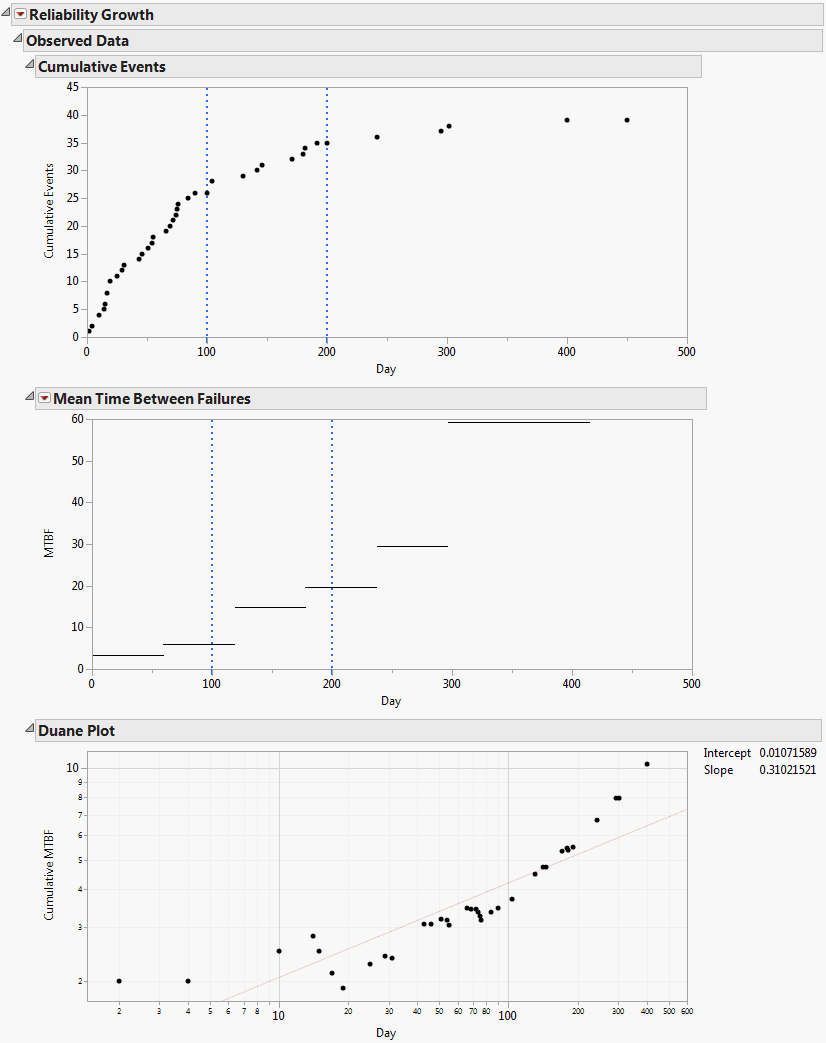
The Observed Data report contains the Cumulative Events plot, the Mean Time Between Failures plot, and the Duane plot. These are shown in Figure 10.7, where we have opened the Mean Time Between Failures and Duane Plot reports. To produce this report, follow the instructions in Example Using the Reliability Growth Platform.
Figure 10.7 Observed Data Report
|
•
|
The Intercept value is given, for historical reasons, as the intercept for a fit in the natural logarithmic scale. Specifically, the natural logarithm of Cumulative MTBF is regressed on the natural logarithm of Time to Event. The value of Intercept is the value predicted by this regression equation at log(1) = 0, where log is the natural logarithm. To obtain the intercept for a fit in terms of base 10 logarithms, divide the Intercept value by log(10). See Tobias and Trindade (2012, ch. 13).
|
