The sample data table Diabetes.jmp was used to create a report for the categorical response Y Binary.
Figure 5.6 Partition Report for a Categorical Response
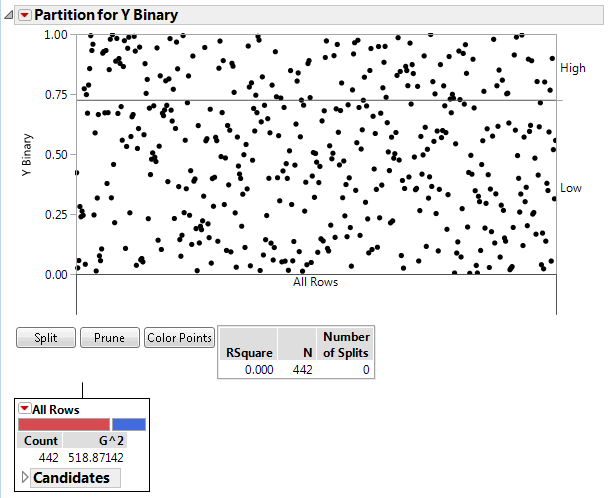
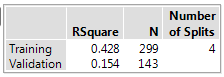
Figure 5.7 Summary Report for a Categorical Response
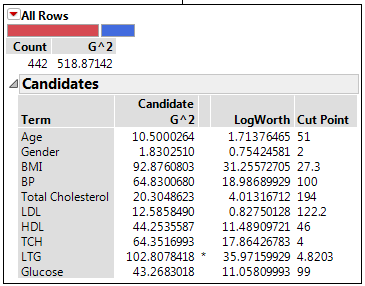
G2
A fit statistic used for categorical responses (instead of sum of squares that is used for continuous responses). Lower values indicate a better fit. See Statistical Details for the Partition Platform.
The LogWorth statistic, defined as -log10(p-value). The optimal split is the one that maximizes the LogWorth. See Statistical Details for the Partition Platform for additional details.
The optimal split is noted by an asterisk. However, there are cases where the Candidate G2 is higher for one variable, but the Logworth is higher for a different variable. In this case > and < are used to point in the best direction for each variable. The asterisk corresponds to the condition where they agree. See Statistical Details for the Partition Platform for details.