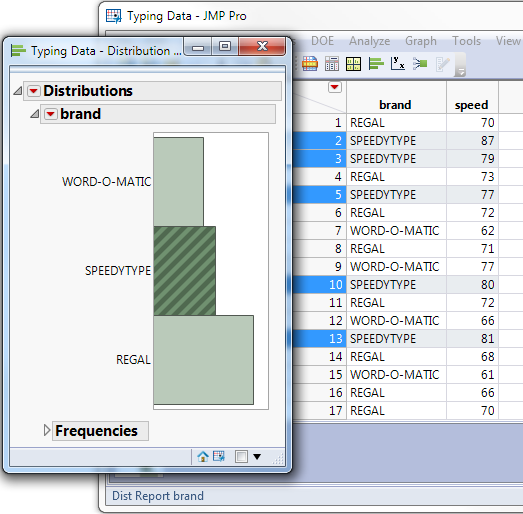
All graphs and plots that represent the same data table are linked to each other and to the corresponding data table. When you click points in plots or bars of a graph, the corresponding rows highlight in the data table. The example in Figure 9.19 shows a histogram with the SPEEDYTYPE bar highlighted, and the corresponding rows highlighted in the table. You can also extend the selection of bars in a histogram by holding down the Shift key and then making your selection.
Figure 9.19 Highlighting Rows in a Histogram