 Solution Path
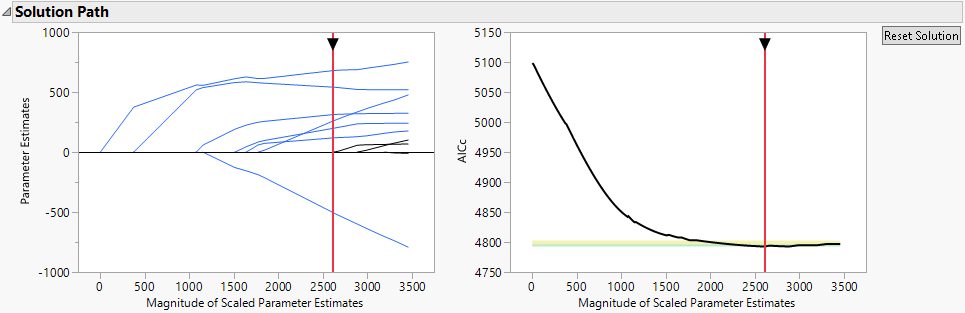
The horizontal scaling for both plots is given in terms of the Magnitude of Scaled Parameter Estimates. This is the l1 norm, defined as the sum of the absolute values of the scaled parameter estimates for the model for the mean. (Estimates corresponding to the intercept, dispersion parameters, and zero-inflation parameters are excluded from the calculation of the l1 norm.) Note the following:
|
•
|
|
•
|
|
•
|
 Current Model Indicator
A solid vertical red line is placed in both plots at the value of the l1 norm for the solution displayed in the Parameter Estimates for Original Predictors report. You can drag the arrow at the top of the vertical red line in either plot to change the magnitude of the penalty, indicating a new current model. In the Validation Plot, you can also click anywhere in the plot to change the model. As you drag the vertical red line to indicate a new model, the results in the report update to reflect the currently selected model. A dashed vertical line remains at the best fit model. You can click the Reset Solution button next to the Validation Plot to return the vertical red line and corresponding results to the initial solution. For some validation methods, the Validation Plot provides zones that identify comparable models. See Comparable Model Zones.
For more information about the Solution Path Plot, see Solution Path Plot. For more information about the Validation Plot, see Validation Plot.
 Solution Path Plot
The Parameter Estimates are plotted using the vertical axis of the Solution Path Plot. These are the scaled parameter estimates. They are derived for a model expressed in terms of centered and scaled predictors (see Parameter Estimates for Centered and Scaled Predictors).
 The Solution ID
Internally, each solution in the Solution Path is assigned a Solution ID. When you adjust the tuning parameter to select a solution other than the one initially presented, the corresponding Solution ID appears in scripts created by the Save Script options. The Solution ID is the value N in the Set Solution ID( N ) command. Saving the Solution ID ensures that you can re-create your selected solution when you run the script.
 Validation Plot
The Validation Plot shows plots of statistics that describe how well models fit across the values of the tuning parameter, or equivalently, across the values of the Magnitude of the Scaled Parameter Estimates. The statistics plotted depend on the selected Validation Method. For each Validation Method, Table 6.3 lists the statistic that is plotted. For all validation methods, smaller values are better. For the KFold and Leave-One-Out validation methods, and for a Validation Column with more than three values, the statistic that is plotted is the mean of the scaled negative log-likelihood values across the folds.
The Scaled -LogLikelihood in Table 6.3 is the negative log-likelihood divided by the number of observations in the set for which the negative log-likelihood is computed.
|
Validation Column with K > 3 values
|
 Comparable Model Zones
Although a model is estimated to be the best model, there can be uncertainty relative to this selection. Competing models might fit nearly as well and can contain useful information. For the AICc, BIC, KFold, and Leave-One-Out validation methods, and for a Validation Column with more than three values, the Validation Plot provides zones that identify competing models that might deserve consideration. Models that fall outside the zones are not recommended. See Burnham and Anderson (2004) and Burnham et al. (2011).
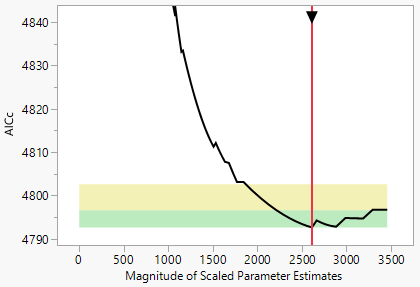
A zone is an interval of values of the validation statistics. The zones are plotted as green or yellow rectangles that span the entire horizontal axis. A model falls in a zone if the value of its validation statistic falls in the zone. You can drag the solid vertical red line to explore solutions within the zones. See Current Model Indicator.
Figure 6.6 shows a Validation Plot for Diabetes.jmp with the vertical axis expanded to show the two zones.
|
•
|
|
•
|
For these validation methods, two regions are shown in the plot. At the solution for the best model, the scaled negative log-likelihood functions are evaluated for each validation set. Denote the standard error of these values as LSE. Denote the scaled negative log-likelihood for the best solution by Lbest.
|
•
|