Let X denote the matrix of predictors and Y the matrix of response values, which might be centered and scaled based on your selections in the launch window. Assume that the components of Y are independent and normally distributed with a common variance σ2.
Hoskuldsson (1988) observes that the PLS model for Y in terms of scores is formally similar to a multiple linear regression model. He uses this similarity to derive an approximate formula for the variance of a predicted value. See also Umetrics (1995). However, Denham (1997) points out that any value predicted by PLS is a non-linear function of the Ys. He suggests bootstrap and cross validation techniques for obtaining prediction intervals. The PLS platform uses the normality-based approach described in Umetrics (1995).
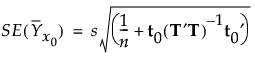
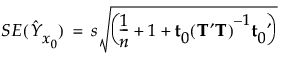
Denote the matrix whose columns are the scores by T and consider a new observation on X, x0. The predictive model for Y is obtained by regressing Y on T. Denote the score vector associated with x0 by t0.
Let a denote the number of factors. Define s2 to be the sum of squares of residuals divided by df = n - a -1 if the data are centered and df = n - a if the data are not centered. The value of s2 is an estimate of σ2.
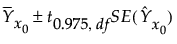
Let t0.975, df denote the 0.975 quantile of a t distribution with degrees of freedom df = n - a -1 if the data are centered and df = n - a if the data are not centered.
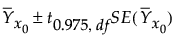
Let t0.975, df denote the 0.975 quantile of a t distribution with degrees of freedom df = n - a -1 if the data are centered and df = n - a if the data are not centered.