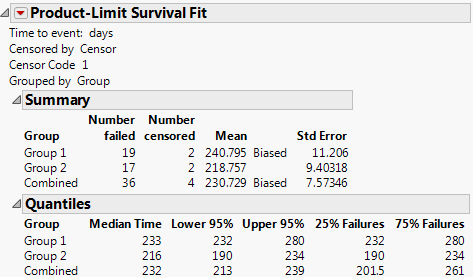
For data that is not interval censored, the initial reports show Summary and Quantiles data (Figure 13.15). The Summary data shows the number of failed and number of censored observations for each group (when there are groups) and for the whole study. The mean and standard deviations are also adjusted for censoring. For computational details about these statistics, see the LIFETEST Procedure chapter in the SAS/STAT 14.3 User’s Guide (2017).
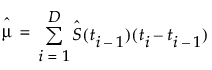 with a standard error of
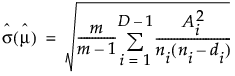
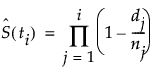
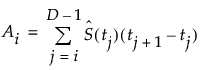

 is the survival distribution at time
 D is the number of distinct event times
t0 is defined to be 0
When there are multiple groups, the Tests Between Groups table provides statistical tests for homogeneity among the groups. Kalbfleisch and Prentice (1980, ch. 1), Hosmer and Lemeshow (1999, ch. 2), and Klein and Moeschberger (1997, ch. 7) discuss statistics and comparisons of survival curves.
Figure 13.16 Tests between Groups
The Log-Rank test places more weight on larger survival times and is more useful when the ratio of hazard functions in the groups being compared is approximately constant. The hazard function is the instantaneous failure rate at a given time. It is also called the mortality rate or force of mortality.
The Wilcoxon test places more weight on early survival times and is the optimum rank test if the error distribution is logistic. See Kalbfleisch and Prentice (1980).
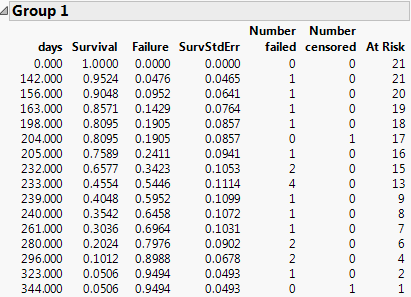
Figure 13.17 shows an example of the product-limit survival function estimates for one group.
Figure 13.17 Example of Survival Estimates Table
Note: When the final time recorded is a censored observation, the report indicates a biased mean estimate. The biased mean estimate is a lower bound for the true mean.