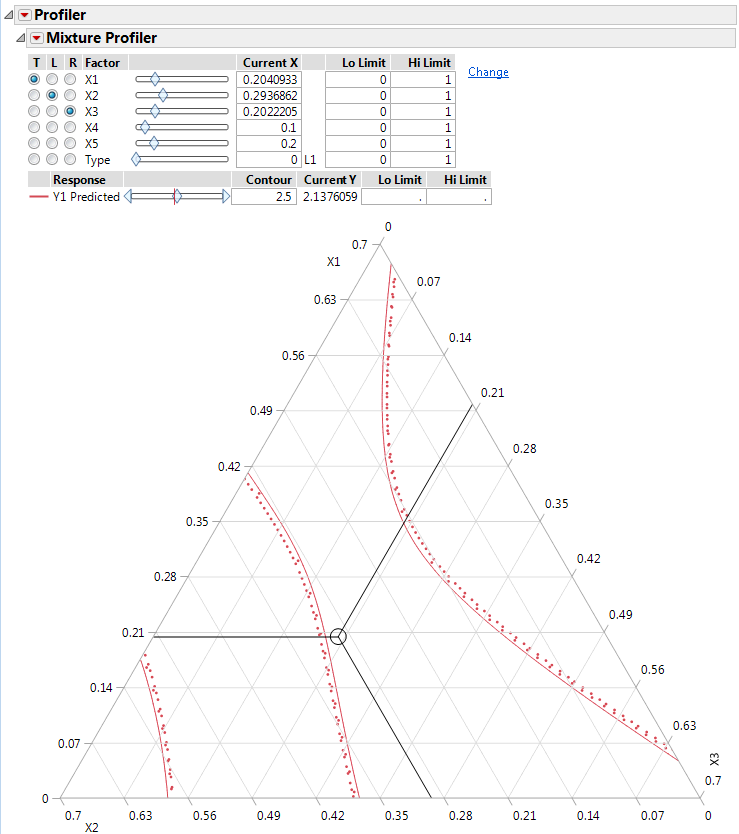
Figure 6.3 shows the Mixture Profiler Ternary Plot for an experiment with 5 factors. The Five Factor Mixture.jmp data table is being used, with the Y1 Predicted column as the formula. The on-axis factors are x1, x2, and x3, and the factors x4 and x5 are off-axis. There are no constraints on any of the mixture components. Note that all Lo Limit values are set to 0 and all Hi Limit values set to 1. The value for x4 is 0.1 and the value for x5 is 0.2, for a total of 0.3. The sum of x1, x2, and x3 is equal 1 – 0.3 = 0.7. Note that the maximum value for a plot axis is now 0.7, not 1.
If you change the value for either x4 or x5, then the values for x1, x2, and x3 change, maintaining their relative proportions, to accommodate the constraint that factor values sum to 1.