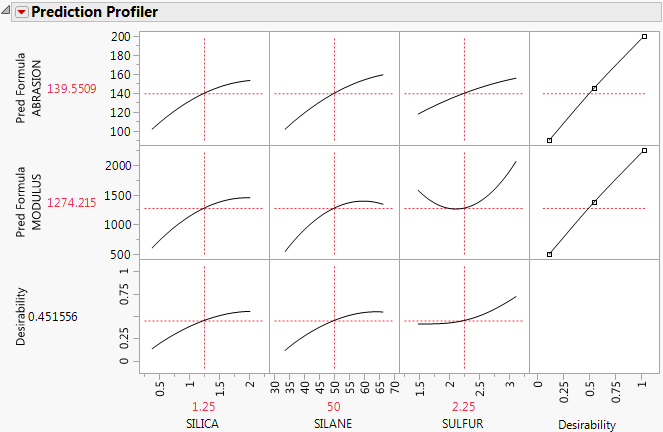
The last row of plots shows the desirability trace for each factor. The numerical value beside the word Desirability on the vertical axis is the geometric mean of the desirability measures. This row of plots shows both the current desirability and the trace of desirabilities that result from changing one factor at a time.
For example, Figure 3.13 shows desirability functions for two responses. You want to maximize ABRASION and MODULUS. The desirability plots indicate that you could increase the desirability by increasing any of the factors.
