The top portion of the resulting report shows the fitting of the Expected response. Table 8.2 describes how the fit statistics are calculated. The Parameter Estimates and Fixed Effect Tests are similar to reports found in the standard least squares personality, though they are derived from restricted maximum likelihood (REML).
Figure 10.4 Mean Model Output
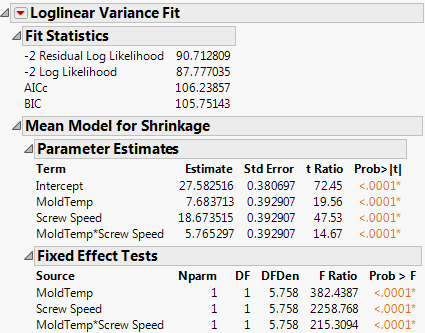
Figure 10.5 Variance Model Output
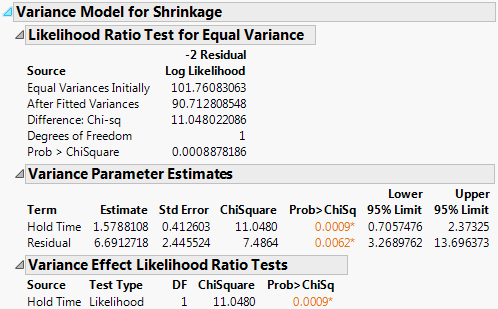
The second portion of the report shows the fit of the variance model. The Variance Parameter Estimates report shows the estimates and relevant statistics. Two hidden columns are provided:
|
•
|
The hidden column exp(Estimate) is the exponential of the estimate. So, if the factors are coded to have +1 and -1 values, then the +1 level for a factor multiplies the variance by the exp(Estimate) value. Likewise, the -1 level multiplies the variance by the reciprocal of this column. To see a hidden column, right-click on the report and select the name of the column from the Columns menu that appears.
|
|
•
|
The hidden column labeled exp(2|Estimate|)is the ratio of the higher to the lower variance if the regressor has the range -1 to +1.
|
The report also shows the standard error, chi-square, p-value, and profile likelihood confidence limits of each estimate. The residual parameter is the overall estimate of the variance, given all other regressors are zero.
Does the variance model fit significantly better than the original model? The likelihood ratio test for this question compares the fitted model with the model where all parameters are zero except the intercept, the model of equal-variance. In this case the p-value is highly significant. Changes in Hold Time change the variance.
The Variance Effect Likelihood Ratio Tests refit the model without each term in turn to create the likelihood ratio tests. These are generally more trusted than Wald tests.