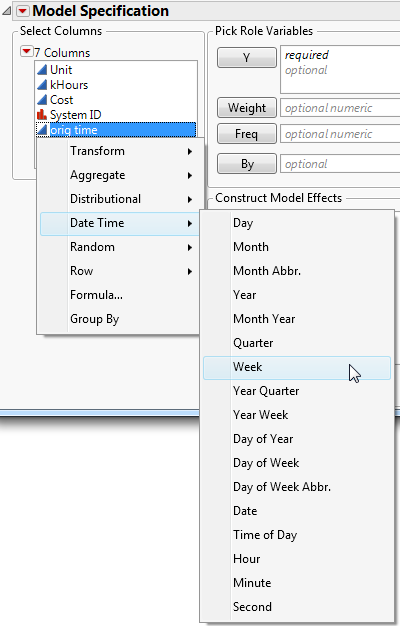
Figure 4.39 Example of Transform Column Menu
|
•
|
The transform column is available only in the current launch window. To make the transform column available outside of the current launch window, right-click the transform column and select Add to Data Table. The transform column is added to the source data table.
|
|
•
|
Select a function from the Transform menu to create a transform column containing the calculations based on the selected function. For details, see the Scripting Index in the Help menu or Transform in Fitting Linear Models.
 |
|
 |
|
|
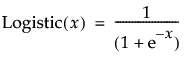
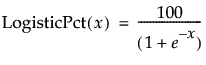
Calculates the inverse of the logistic function for the selected column (where p is in the range of 0 to 1):
 |
|
 |
|
|
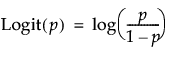
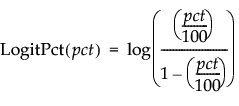
Calculates the logit as a percent for the selected column (where pct is a percent in the range of 0 to 100):
 |
|
 |
Returns the nth root of the product of the data.
Returns the nth root of the product of the data.
Transforms the data using the Box-Cox equation. For details, see Box Cox Y Transformation in Fitting Linear Models.
Creates two columns. The Informative column replaces missing values with the column mean. The Is Missing column indicates 1 for missing values, and 0 otherwise.
Generates a random integer. The result for the first value does not the result for the second value.
For column values containing date or time values, select a function from the Date Time menu to create a transform column containing values calculated from the selected column.