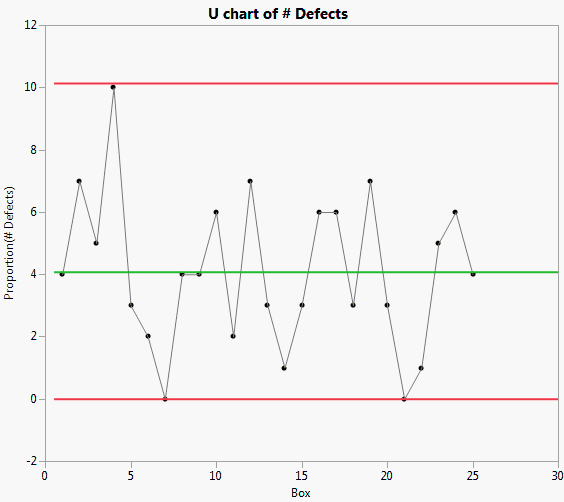
The Shirts.jmp sample data table contains data concerning the number of defects found in a number of boxes of shirts.
|
1.
|
|
2.
|
Select Analyze > Quality and Process > Control Chart Builder.
|
|
3.
|
|
4.
|
|
5.
|
To change the chart to an Attribute chart, select Shewhart Attribute from the drop-down list.
|
A c-chart of # Defects appears.
|
6.
|
Figure 3.22 u-chart of # Defects