The Wilcoxon test allows tied values. The test statistic is adjusted for differences of zero using a method suggested by Pratt. See Lehmann and D’Abrera (2006), Pratt (1959), and Cureton (1967).
|
•
|
There are N observations:
|
|
•
|
The differences between observations and the hypothesized value m are calculated as follows:
|
|
•
|
There are N pairs of observations from two populations:
|
 , are ranked from smallest to largest.
|
•
|
When there are tied absolute differences, they are assigned the average, or midrank, of the ranks of the observations.
|
 by
by  as follows:
 is positive, the signed rank is
  is zero, the signed rank is 0.
 is negative, the signed rank is -
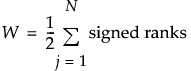
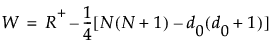
 is the number of signed ranks that equal zero
R+ is the sum of the positive signed ranks
For  , exact p-values are calculated.
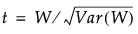
, exact p-values are calculated.For N > 20, a Student’s t approximation to the statistic defined below is used. Note that a correction for ties is applied. See Iman (1974) and Lehmann and D’Abrera (2006).
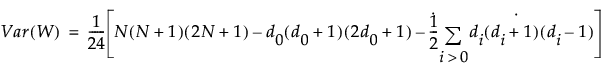
The last summation in the expression for Var(W) is a correction for ties. The notation di for i > 0 represents the number of values in the ith group of nonzero signed ranks. (If there are no ties for a given signed rank, then di = 1 and the summand is 0.)
The statistic t given by the following has an approximate t distribution with N - 1 degrees of freedom: