|
1.
|
|
2.
|
Select Analyze > Quality and Process > Control Chart Builder.
|
|
3.
|
|
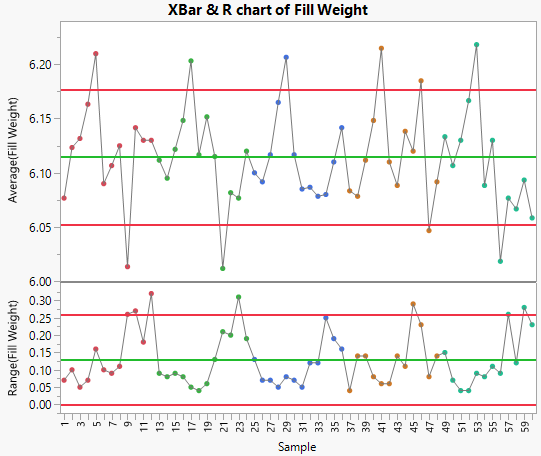
4.
|
Figure 2.26 XBar & R Chart for Fill Weight
|
5.
|
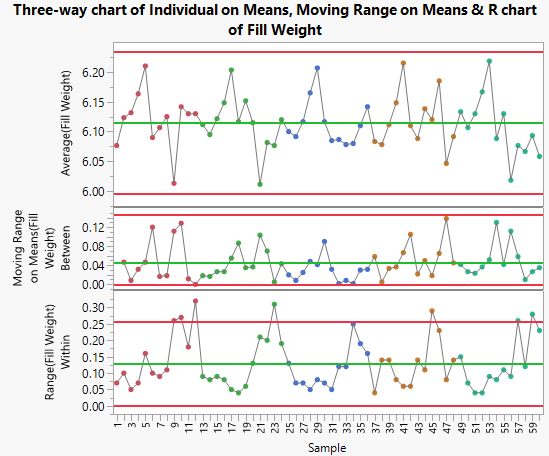
At bottom left, click 3-Way Chart.
|
Figure 2.27 3-Way Chart for Fill Weight