This example uses the Iris.jmp sample data table, which includes measurements of sepal length, sepal width, petal length, and petal width for three species of irises.
|
1.
|
|
2.
|
Select Analyze > Clustering > K Means Cluster.
|
|
3.
|
|
4.
|
Click OK.
|
|
5.
|
Select Self Organizing Map from the Method menu on the Control Panel.
|
|
6.
|
|
7.
|
Click Go.
|
|
9.
|
|
10.
|
Click Go.
|
|
12.
|
|
13.
|
Click Go.
|
Figure 11.10 SOM Cluster Comparison
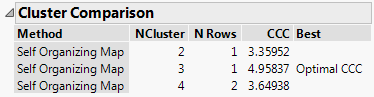
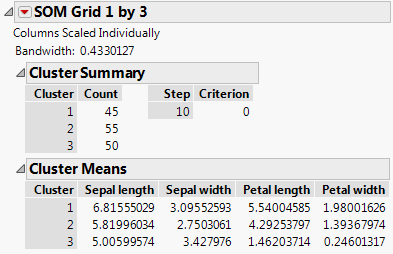
Figure 11.11 Self-Organizing Map Report for Iris.jmp
|
15.
|
|
16.
|
Select the Classic option under Markers.
|
|
17.
|
Click OK.
|
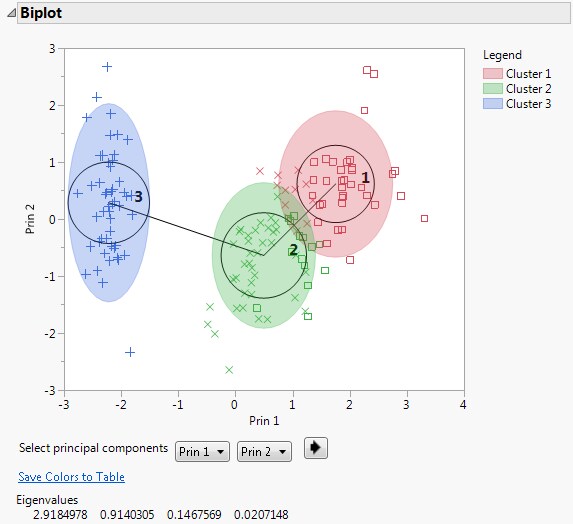
Figure 11.12 SOM Biplot