 Additional Example of the Functional Data Explorer Platform
 Example for Multiple Functional Processes
This example uses the Fermentation Process.jmp and Fermentation Process Batch Yield Results.jmp sample data tables to analyze enzyme production. Yield is the amount of an enzyme produced by genetically modified yeast. There are 100 process measurements per batch that were taken at equally-spaced times over a 12-hour period.
|
1.
|
|
2.
|
Select Analyze > Specialized Modeling > Functional Data Explorer.
|
|
3.
|
|
4.
|
|
5.
|
|
6.
|
Click OK.
|
|
7.
|
Press Ctrl, click any Data Processing red triangle, and select Align > Align Range 0 to 1. This aligns the input variable to be between 0 and 1 in each Functional Data Explorer report.
|
|
8.
|
Press Ctrl, click any Functional Data Explorer red triangle, and select Models > B-Splines. This fits a B-spline model to each of the functional processes.
|
Figure 13.7 Functional Data Explorer Report for Ethanol
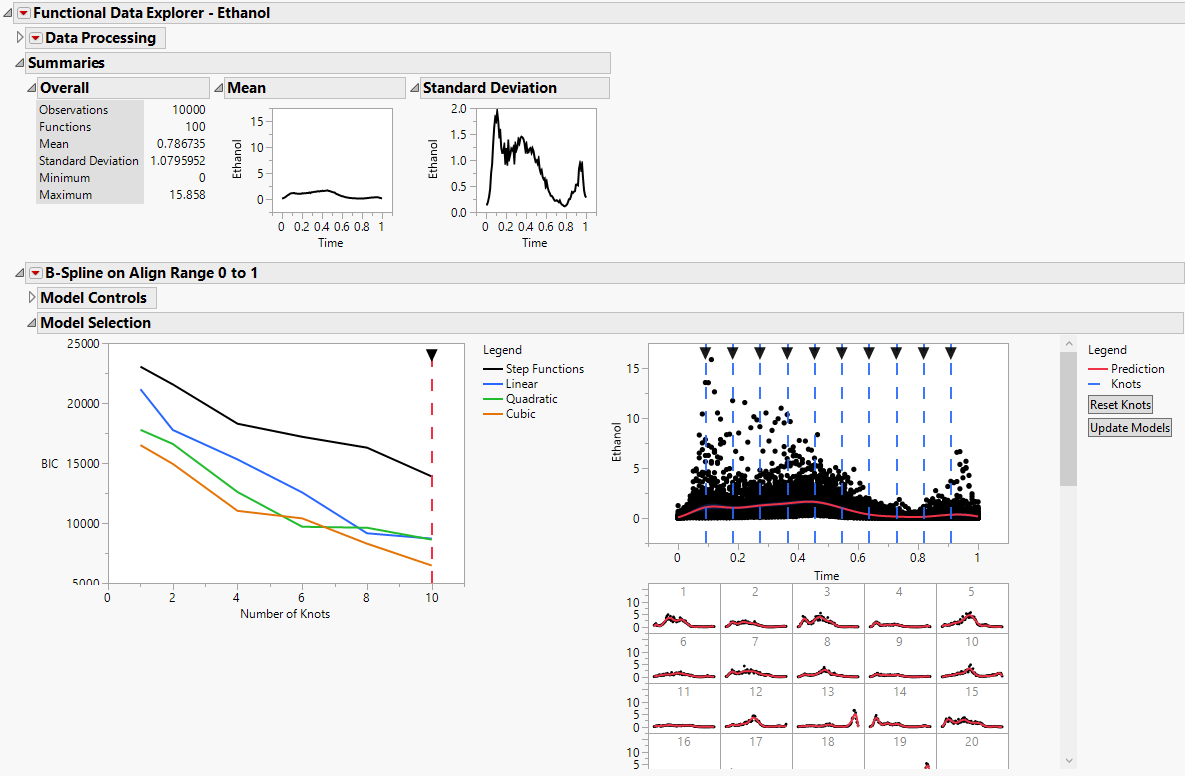
Figure 13.8 Model Summary Report for Ethanol
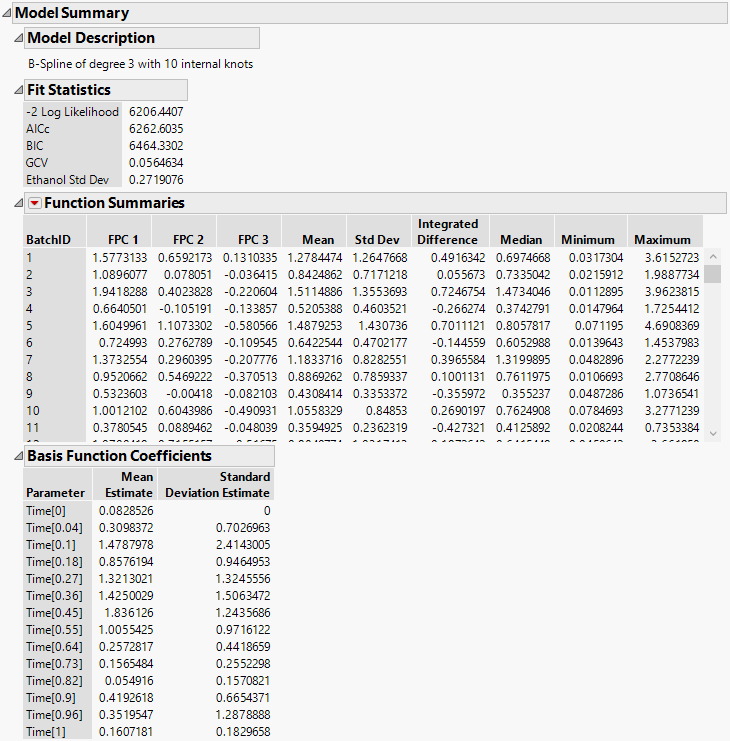
Figure 13.7 and Figure 13.8 show the model reports for one of the functional process variables, Ethanol. Scroll through the full report to view the models fit for each of the process variables. Next, you will use the FPCs in the Function Summaries report in an analysis.
|
1.
|
Press Ctrl, click any Function Summaries red triangle, and select Customize Function Summaries.
|
|
3.
|
Click OK.
|
|
4.
|
Click any Functional Data Explorer red triangle and select Save Model Summaries for All Y.
|
|
5.
|
|
6.
|
In the Functional Data Explorer Model Summaries.jmp data table, right-click BatchID and deselect Link ID.
|
|
7.
|
In the Functional Data Explorer Model Summaries.jmp data table, right-click BatchID and select Link Reference > Fermentation Process Batch Yield Results.jmp.
|
Use the Generalized Regression personality of the Fit Model platform to determine how Yield is affected by the functional process variables.
|
1.
|
|
2.
|
|
3.
|
|
5.
|
Click Run.
|
|
6.
|
Click Go.
|
Figure 13.9 Generalized Regression Report for Batch Yield
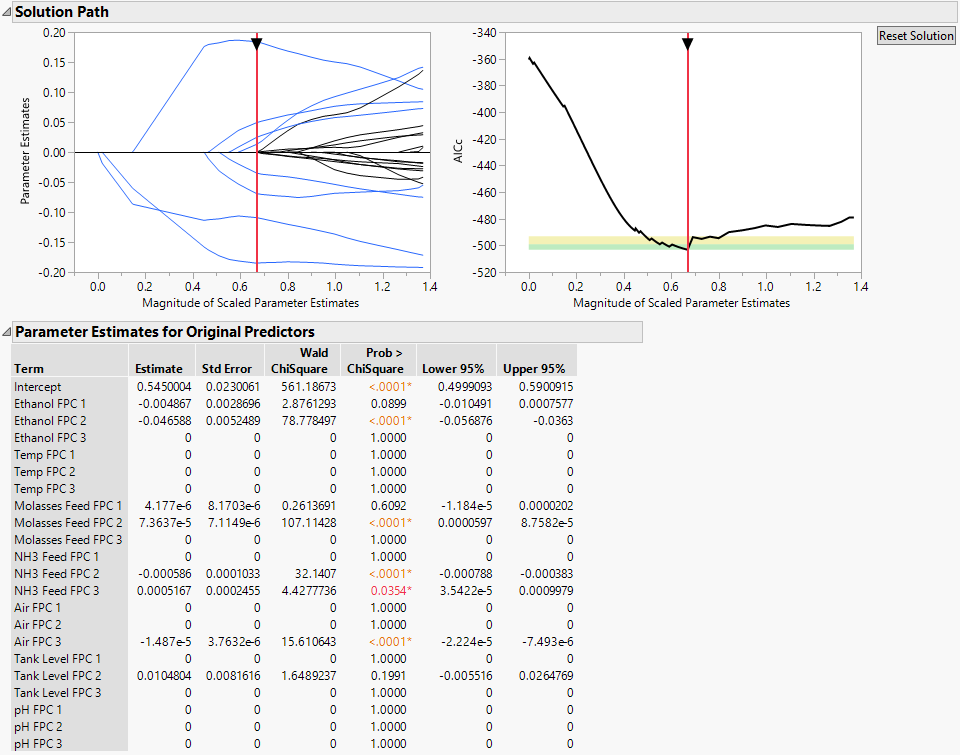
The Generalized Regression report shows that Yield is significantly affected by certain components of Ethanol, Molasses Feed, NH3 Feed, and Air. The RSquare for the model is 0.7999. By using FDE to perform dimension reduction on the functional processes first, you greatly reduce the number of variables, while still retaining a good prediction models.