The Water Treatment.jmp data set contains daily measurement values of 38 sensors in an urban waste water treatment plant. You are interested in exploring these data for potential outliers. Potential outliers could include sensor failures, storms, and other situations.
|
1.
|
|
2.
|
Select Analyze > Screening > Explore Outliers.
|
|
3.
|
|
4.
|
Click OK.
|
|
5.
|
Select Multivariate k-Nearest Neighbor Outliers.
|
|
7.
|
Click OK.
|
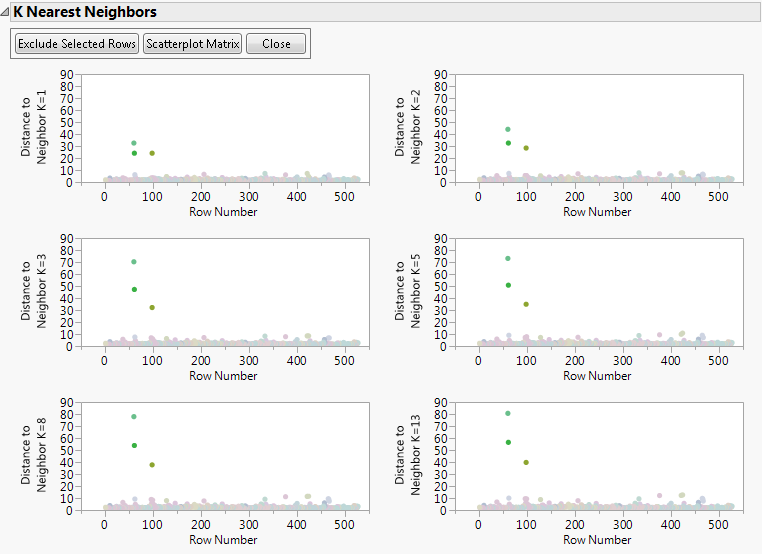
Notice the three extreme outliers selected in the K Nearest Neighbors plots in Figure 2.9. Each of these three rows corresponds to a date when the secondary settler in the water treatment plant was reported as malfunctioning. Because these three data points are due to faulty equipment, exclude them from future analyses.
|
8.
|
Select the three extreme outliers and click Exclude Selected Rows.
|
|
9.
|
Click Rerun.
|
|
11.
|
Click OK.
|
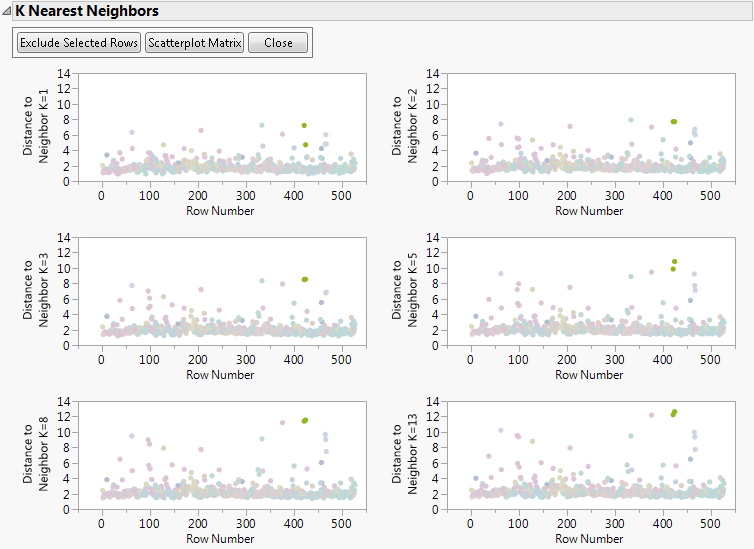
Now locate the two light-green outliers close to row 400. Notice how they tend to stay close to each other as k increases. These two rows correspond to dates when solids overloads were experienced by the water treatment plant. Even though these data points have a relatively high Distance to Neighbor K=13, because they are due to a situation that you want to include in your study, you do not exclude them. Instead, you keep them in mind as you conduct further analyses.